
Figures & data
Table 1. Summary of descriptive statistics
Table 2. Philip-Perron unit root test at level
Table 3. Philip-Perron unit root test at 1st difference
Table 4. VAR model optimal lag lengths check
Table 5. Granger causality Wald test result for the base model
Table 7. Variance decomposition of base model [ordering reflects Cholesky ordering]
Figure 1. Graphs of Variables from Ghana Money Market in Log Levels
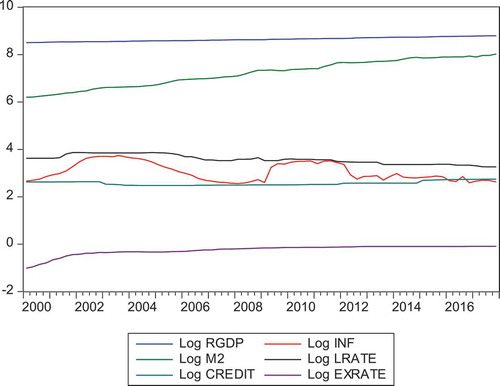
Figure 2. Graphs of Differenced Series of Variables in the Ghanaian Money Market
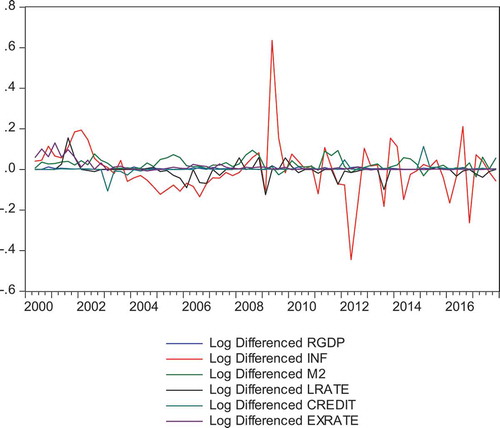
Figure 3. Responses of Real GDP to Exchange Rate
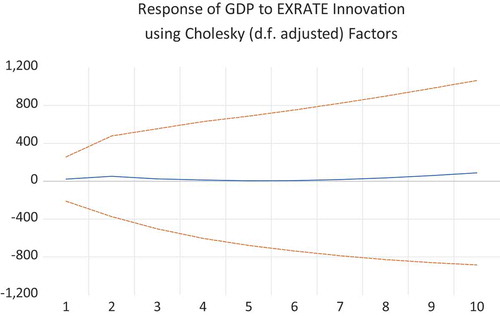
Figure 4. Responses of Inflation to Exchange Rate
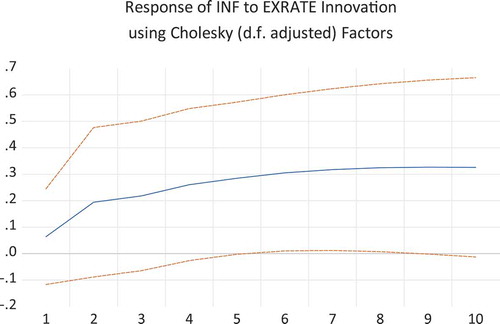
Figure 5. Responses of Money Supply to Exchange Rate
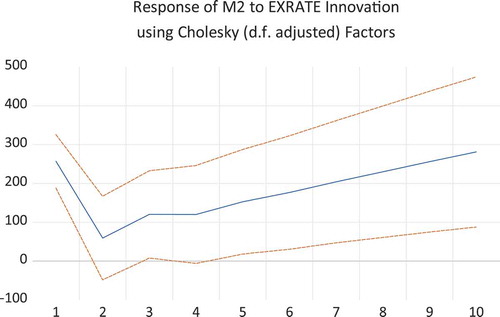
Figure 6. Responses of Lending Rate to Exchange Rate
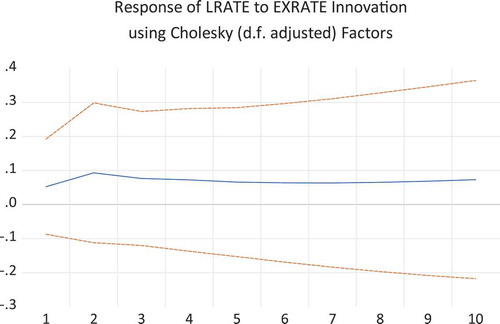
Table A1. Optimal lag length checks for the Basic VAR Model for Ghana
Table A2. VAR Residual correlation LM TEST
Table A3. VAR Residual Portmanteau Test for Autocorrelations
Table A4. VAR Residual Heteroskedasticity Test for the Base VAR Model
Table A5. VAR Residual Normality Test for Skewness
Table A6. VAR Residual Normality Test for Kurtosis
Table A7. VAR Residual Normality Test for Jarque-Bera
Table A8. VAR Lag Exclusion Wald Tests Chi-squared test statistics for lag exclusion: Numbers in () are p values
Table A9. Regression Result for the Base VAR Model for Ghana Standard Errors in () and t-Statistics []