
Figures & data
Table 1. Descriptive statistics: (1978 to 2017)
Table 2. Growth and volatility (Mean and standard deviation for selected macroeconomic variables)
Figure 1. (a) Full sample of countries. (b) Full sample of countries

Figure 1b. (continued)
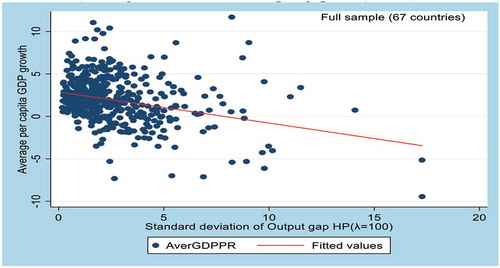
Figure 2. Industrial countries
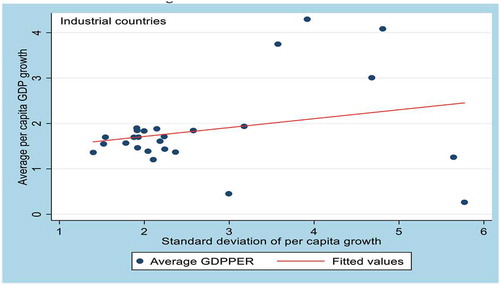
Figure 3. Developing countries
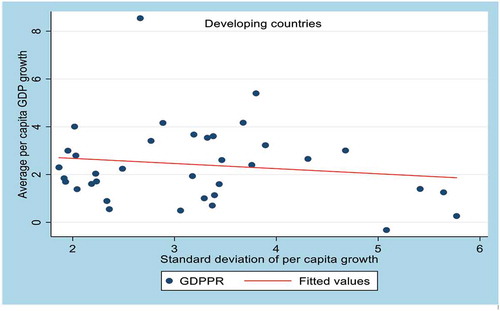
Figure 4. High financial integreted (HFI)
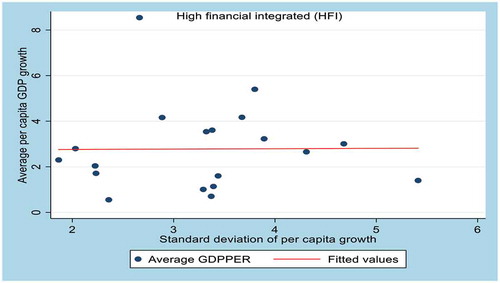
Figure 5. Low financial integreted (LFI)
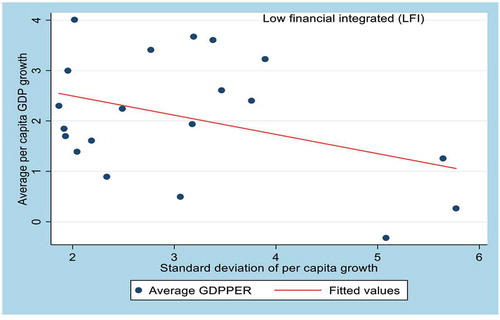
Table 3. Growth and volatility (Mean and standard deviation for selected macroeconomic variables)
Table 4. Cross-section regression GDP per capita growth and volatility (1978–2017) (Volatility as standard deviation of output growth)
Table 5. Cross-section regression GDP per capita growth and volatility (1978–2017) (Volatility as standard deviation of output gap HP λ-100)
Table 6. Cross-section regression GDP per capita growth and its volatility (1978–2017): (volatility as SD of output growth) (Including policy variables and variable)
Table 7. Cross-section regression GDP per capita growth and its volatility (1978–2017): (volatility as SD output gap) (Including policy variables and financial depth variable)
Table 8. Panel regression (fixed vs. random effect) GDP per capita growth and volatility (1978–2017)
Table 9. Fixed-effect estimations of GDP per capita growth and volatility (1978–2017)
Table 10. Random-effect estimations of GDP per capita growth and volatility (1978–2017)
Table A1. List of sample countries (67)