Figures & data
Figure 1. The application of UCM in adjusting Singapore CPI
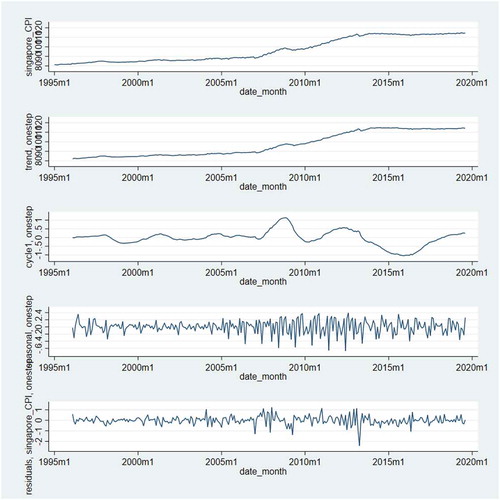
Table 1. Hurst’s exponents
Table 2. Descriptive statistics
Figure 2. Real exchange rate
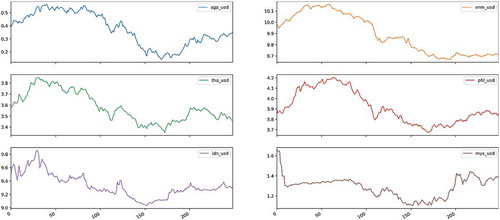
Figure 3. De-noised real exchange rate
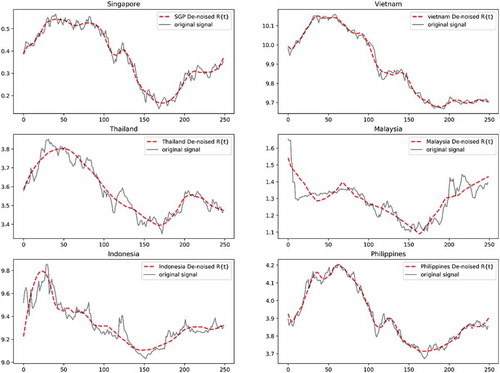
Table 3. Univariate stationary test results
Table 4. Panel stationary test results
Figure 4. Multi-level decomposition of SGP/USD real exchange rate
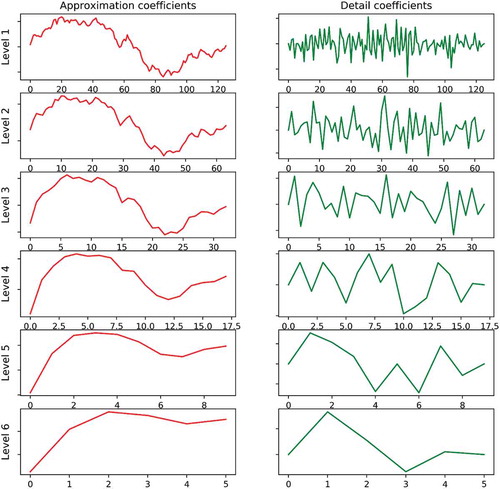
Table 5. Insights of the MRA mechanism
Table 6. Univariate stationary test results on six real exchange rate—Averaging coefficients
Table 7. Univariate stationary test results on six real exchange rate detailed coefficients
Table 8. The multivariate test results on six averaging coefficients and detailed coefficients
Figure 5. ARIMA on six real exchange rate series
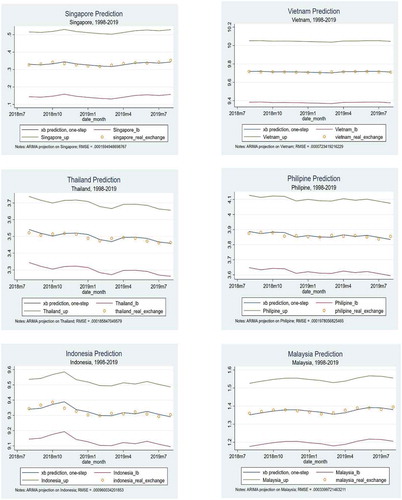
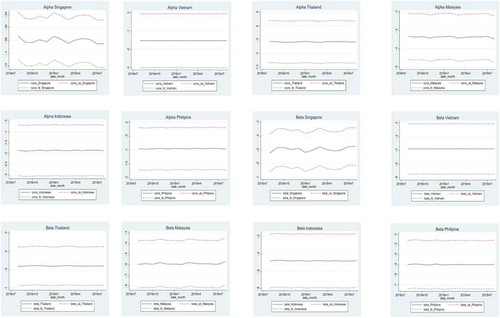
Figure 6. The estimated alpha and beta coefficients