Figures & data
Table 1. Dataset
Table 2. Military expenditure results
Table 3. Final club convergence results (club merging) for military expenditure
Figure 1. Military Expenditure Transitional Curves for club 1
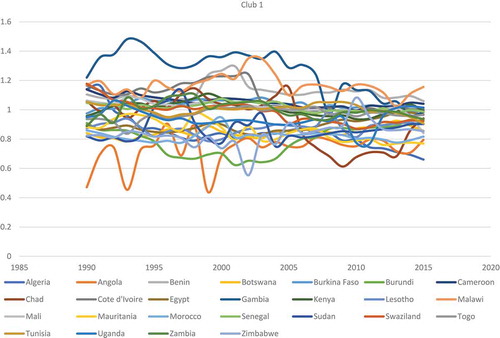
Figure 2. Military Expenditure Transitional Curves for club 2
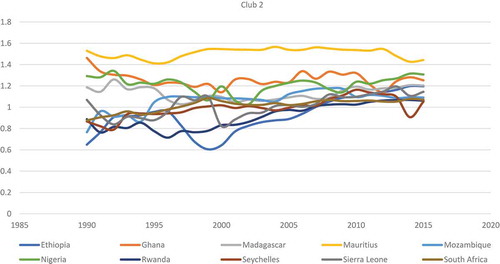
Table 4. Economic growth results
Table 5. Club convergence results (club merging) for economic growth
Figure 3. Growth Transitional Curves for club 1
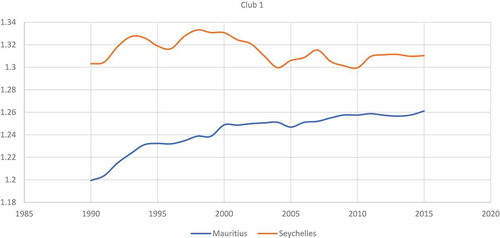
Figure 4. Growth Transitional Curves for club 2
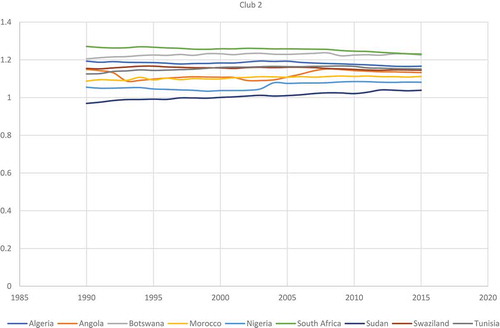
Figure 5. Growth Transitional Curves for club 3
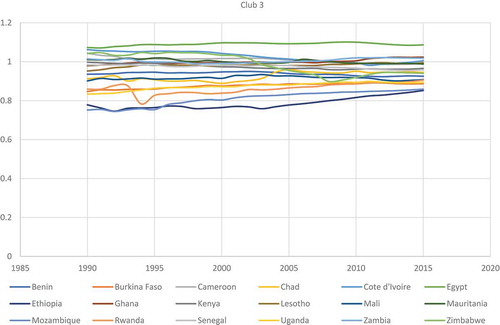
Figure 6. Growth Transitional Curves for club 4
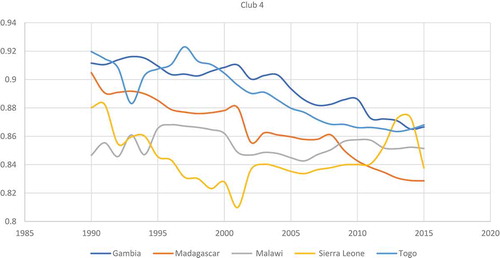
Table 6. Military expenditure and economic growth convergence results for AMU
Figure 7. Military Expenditure Panel Transitional Curves for AMU
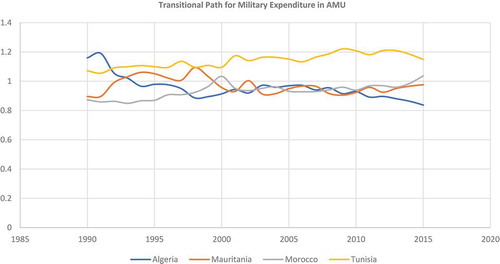
Figure 8. Growth Panel Transitional Curves for AMU
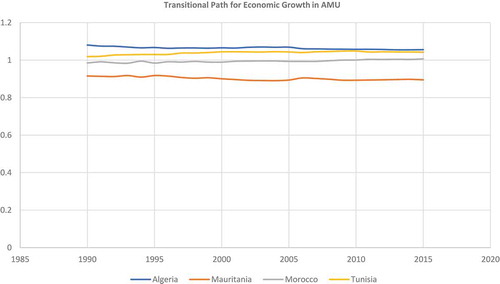
Table 7. Military expenditure and economic growth convergence results for CEN-SAD
Figure 9. Military Expenditure Panel Transitional Curves for CEN-SAD
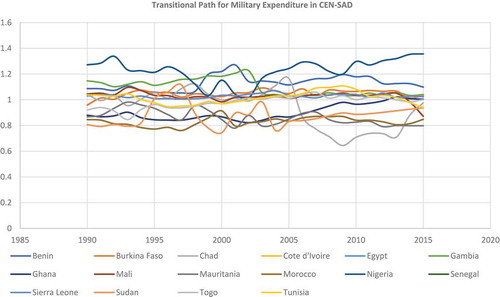
Figure 10. Growth Panel Transitional Curves for CEN-SAD
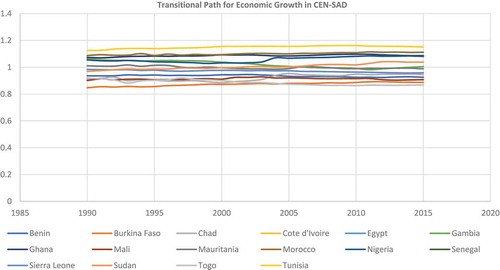
Table 8. Military expenditure and economic growth convergence results for COMESA
Figure 11. Military Expenditure Panel Transitional Curves for COMESA
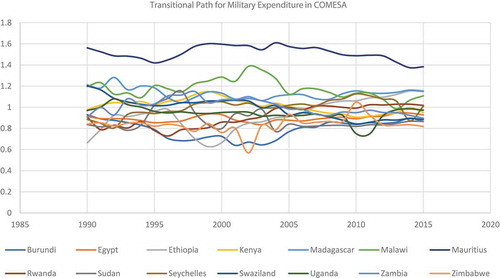
Figure 12. Growth Panel Transitional Curves for COMESA
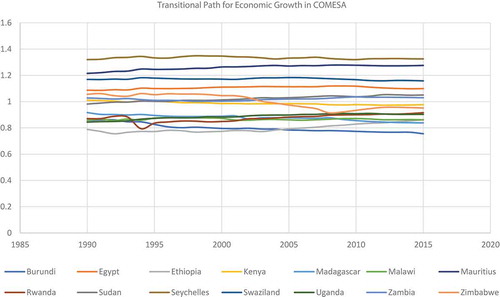
Table 9. Military expenditure and economic growth convergence results for EAC
Figure 13. Military Expenditure Panel Transitional Curves for the EAC
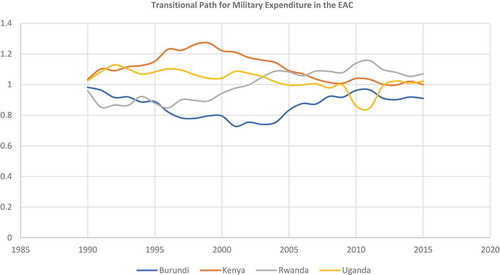
Figure 14. Growth Panel Transitional Curves for the EAC
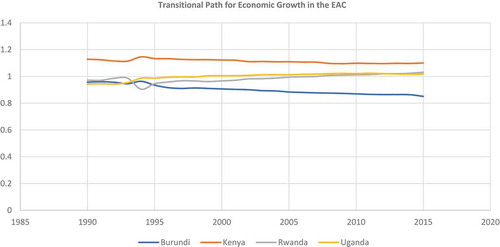
Table 10. Military expenditure and economic growth convergence results for ECCAS
Figure 15. Military Expenditure Panel Transitional Curves for ECCAS
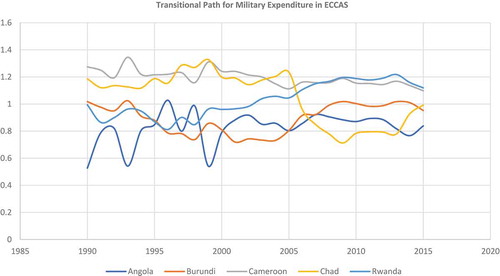
Figure 16. Growth Panel Transitional Curves for ECCAS
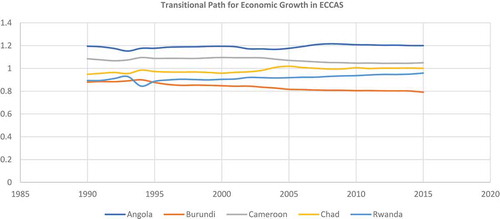
Table 11. Military expenditure and economic growth convergence results for ECOWAS
Figure 17. Military Expenditure Panel Transitional Curves for ECOWAS
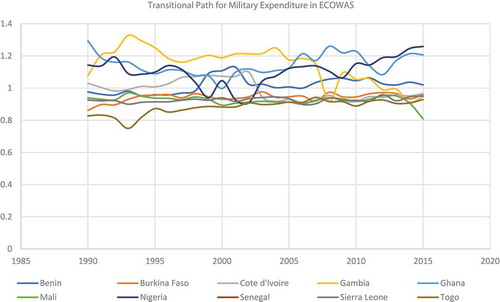
Figure 18. Growth Panel Transitional Curves for ECOWAS
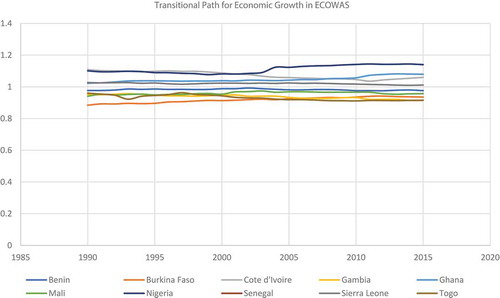
Table 12. Military expenditure and economic growth convergence results for IGAD
Figure 19. Military Expenditure Panel Transitional Curves for IGAD
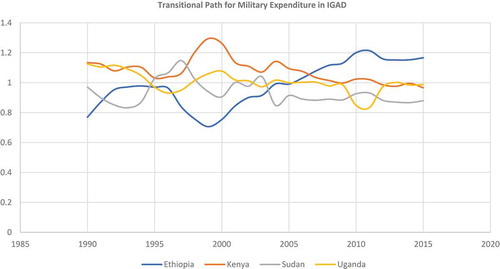
Figure 20. Growth for Panel Transitional Curves for IGAD
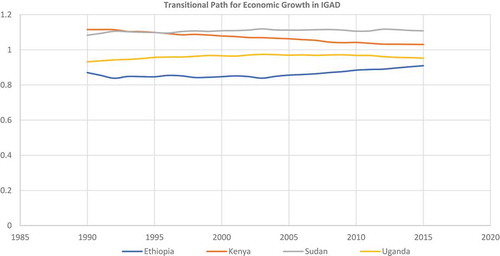
Table 13. Military expenditure and economic growth convergence results for SADC
Figure 21. Military Expenditure Panel Transitional Curves for SADC
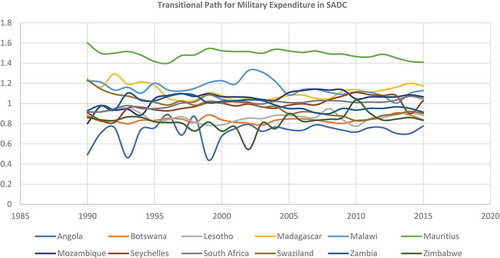
Figure 22. Growth Panel Transitional Curves for SADC
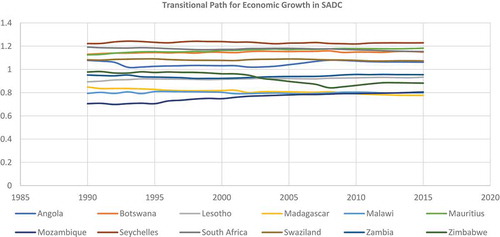
Table A1. List of selected African countries
Table A2. Africa’s regional economic blocks
Figure A1. Trends in Average Percentage of Real GDP Per Capita (RGDPP) in each of the eight African RECs, 1990-2015. Source: Authors’ computation with data from World Development Indicators
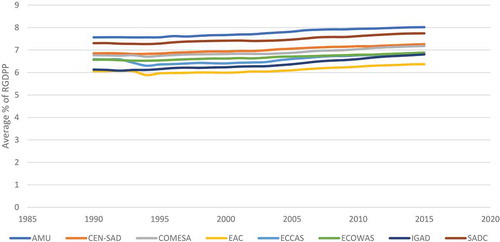
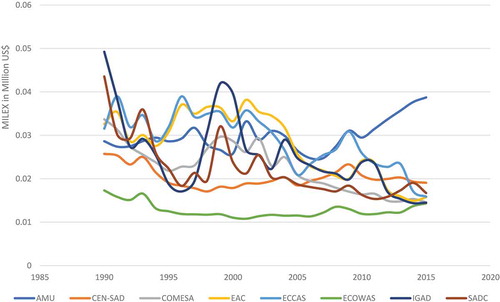
Figure A2. Trends in Average Military Expenditure as a Percentage Share of GDP in each of the eight African Regional Economic Communities, 1990-2015. Source: Authors’ computation with data from the Stockholm International Peace Research Institute