Figures & data
Figure 1. Stages of Big Data analysis (Source: CitationEY (Ernst & Young), 2014)
Figure 2. Risk vs. return per asset class
Figure 3. Logarithmic scale representation of investors per product type
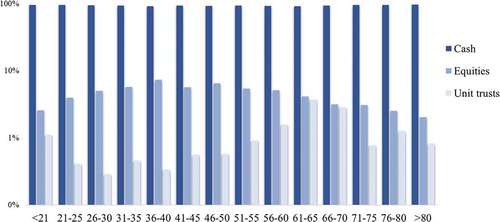
Table 1. Distribution of amounts invested
Table 2. Parameter estimates for linear regression
Figure 4. Average amount invested per product by each gender
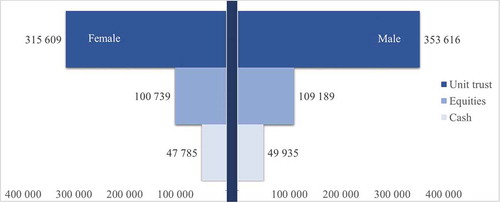
Figure 5. Investment products per investor based on income level
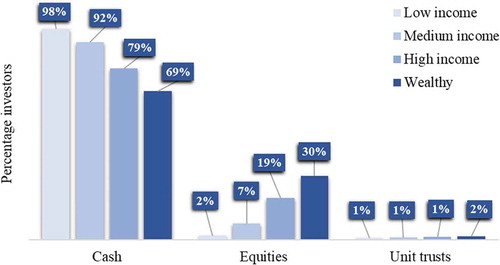
Table 3. Cross-tabulation of race and investment products
Table 4. Parameter results for cash investment amount
Table 5. Parameter results for equities investment amount
Table 6. Parameter results for unit trust investment amount
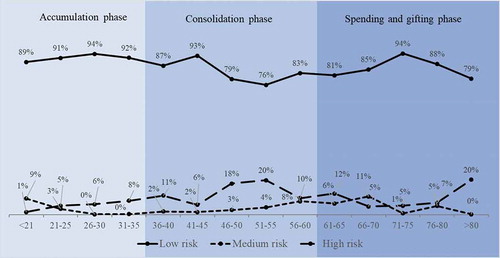
Table 7. Percentage invested per life cycle phase
Figure 6. Product risk level according to the investor life cycle