Figures & data
Table 1. Indices of economic indicators
Table 2. The economic cycle and relative stock performance groups
Table 3. List of expected best performing industries across business cycle stages
Figure 2. Empirical analysis flowchart
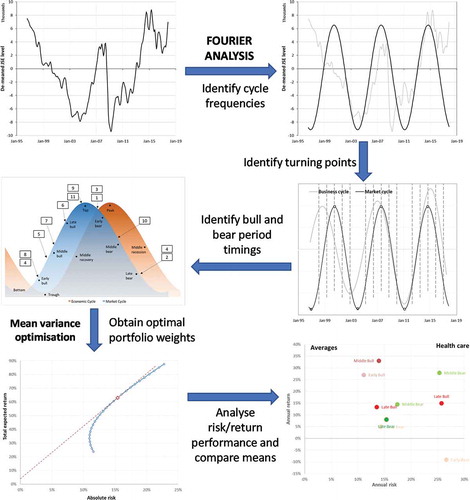
Figure 3. De-trended ALSI returns using first differences
Figure 4. Periodogram of transformed monthly GDP return data
Figure 5. Periodogram of transformed quarterly ALSI return data
Figure 6. Identification of business cycle and market cycle turning point dates
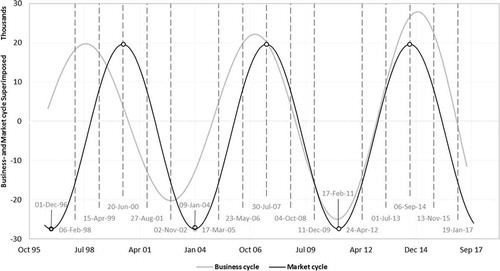
Table 4. Top two performing industries compared with theory
Table 5. Optimal portfolio returns for different sectors and phases
Figure 7. Daily share price—APN Ltd
Figure 8. Health-care risk/return performance—excluding Middle Bull 1
Table 6. Comparing means using t-test (,
)
Figure 9. Probability of sectors outperforming, according to Stovall (Citation1995) theory.