Figures & data
Figure 1. Research roadmap
Table 1. The overview of banking in Indonesia
Table 2. The overview of sustainable development goals indicator
Table 3. General output, model fit indices, and P values
Table 4. Indicator weights
Table 5. Full collinearity VIFs
Table 6. Latent variable coefficient
Table 7. Path coefficients
Table 8. P values
Figure 2. Research result model
Source: output WarpPLS 5.0., 2020
Table 9. Standard error
Table 10. Indirect Effect
Table 11. Defining the difference in the contribution of the Islamic banks and conventional banks on SDGs
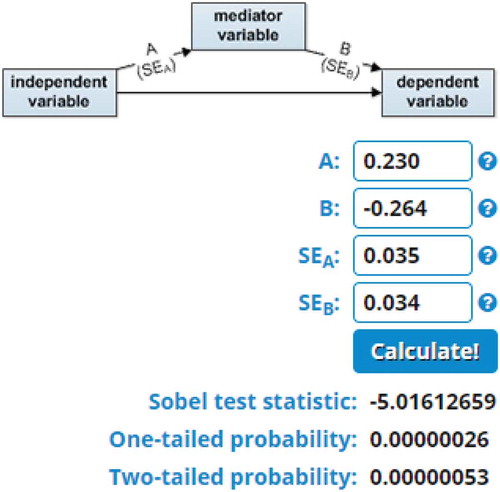
Figure 3. Sobel test result d_sharia → Profits → SDGs
Source: Sobel test output, processed by https://www.danielsoper.com/statcalc/calculator.aspx?id=31, (2020)
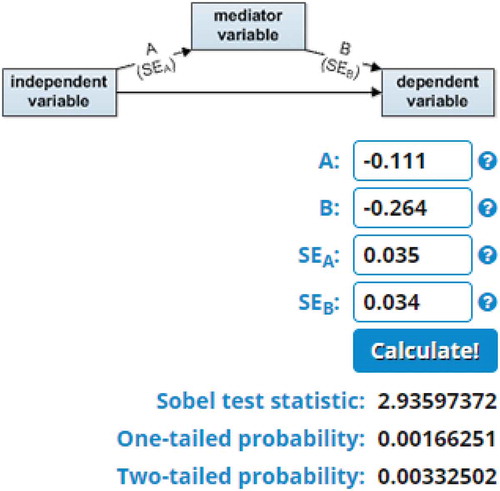
Figure 4. Sobel test credits Result → Profits → SDGs
Source: Sobel test output, processed by https://www.danielsoper.com/statcalc/calculator.aspx?id=31, (2020)