
Figures & data
Figure 1. Contribution of industry, services, and agriculture to GDP, 2009–2019 (%)
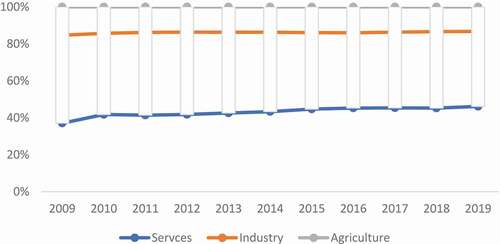
Figure 2. The impact of COVID-19 pandemic on real GDP growth, 2018–2021, actual and projected, Indonesia
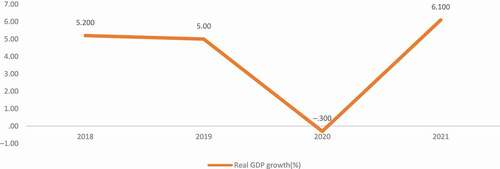
Figure 3. Projected economic contraction and recovery of Indonesia, Malaysia, the Philippines, and Thailand, 2020–2022
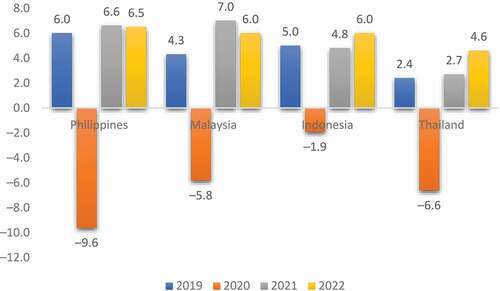
Figure 4. A break-up of the pandemic fallout in all economic sectors in the economy
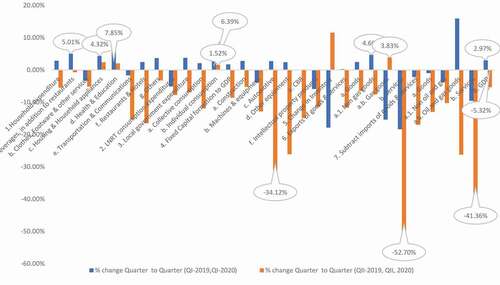
Figure 5. Trajectory of domestic and foreign direct investment, April–June 2019, April–June 2020
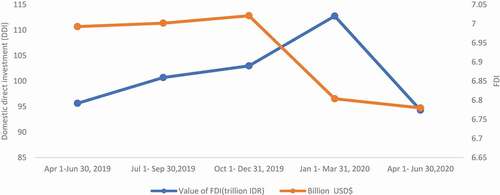
Figure 8. Drastic increase in central government expenditure January–June 2020
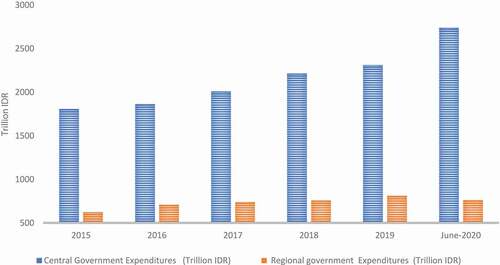
Figure 9. Government spending induced by COVID-19 by area and purpose
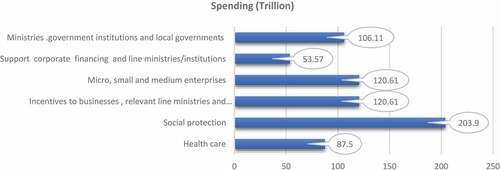
Figure 10. Percentage of countries that have introduced remote learning programs, by education level
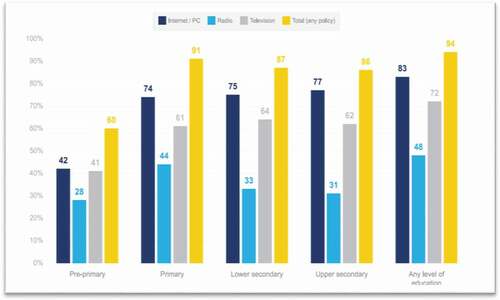
Figure 11. Smartphone ownership in Indonesia, 2015–2025*
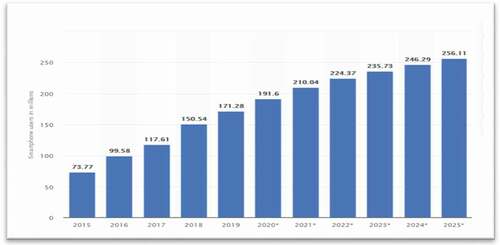
Figure 12. Internet uses in Indonesia, 2015–2025*
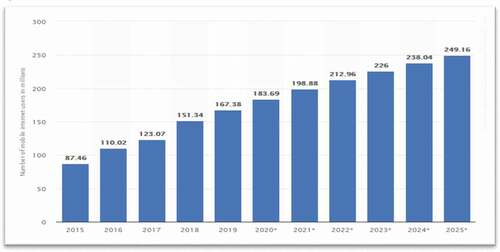
Figure 13. PISA 2018 test scores for Indonesia, Malaysia, Singapore, and Indonesia compared
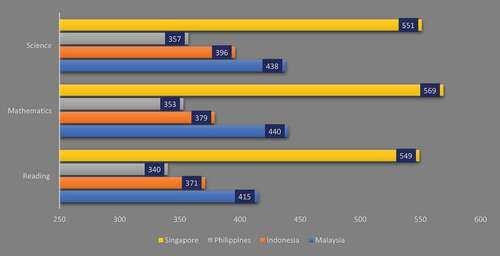
Figure 14. Comparing three PISA 2018 test scores and competitiveness, digitization, e-governance, and Waseda IDG ranks
Figure 16. Unemployment rate trend (% of labor force) 1984–2022*. * Projected. Source: WEO
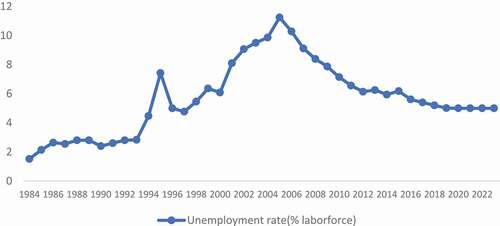
Figure 17. Labor productivity of Indonesian workers per hour worked in US$, 2000–2018
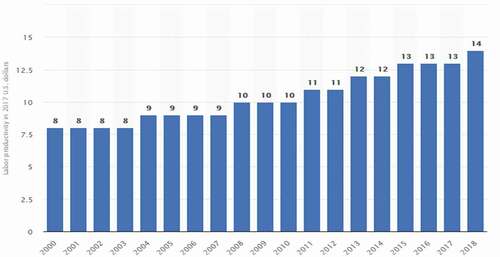
Figure 18. Foreign investment as % of GDP, for some ASEAN states, first half, 2019
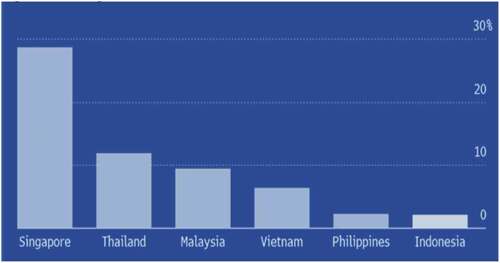
Figure 19. Contribution of sectoral activities to GDP (%), 2019
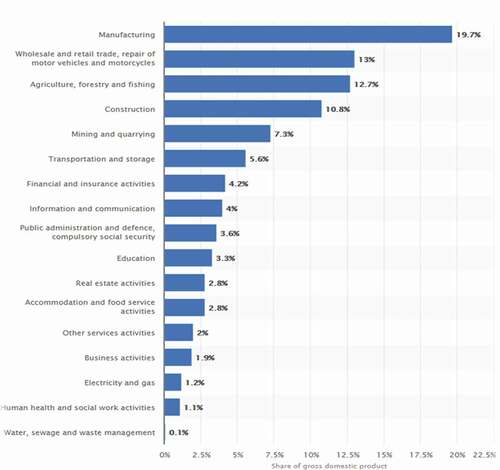
Table A1. Impact of COVID-19 pandemic on the economy in first and second quarter of 2020 (constant 2010 billion Rupiahs)