Figures & data
Figure 1. FDI in renewable electricity industry in Africa over 2003–2019 (Source: fDi Markets, Citation2020).
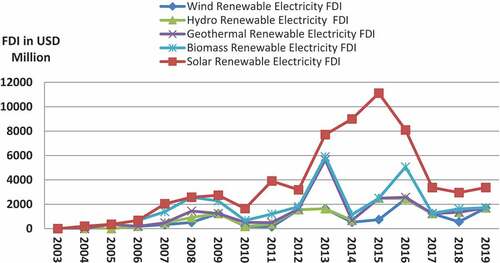
Figure 2. The most invested countries in the renewable electricity industry in Africa over 2003–2019. (Source: fDi Markets, Citation2020).
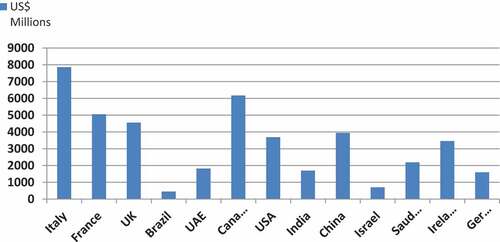
Figure 3. Renewable electricity capacity and generation in Africa over 2003–2019 (Source: IRENA, Citation2015, Citation2020).
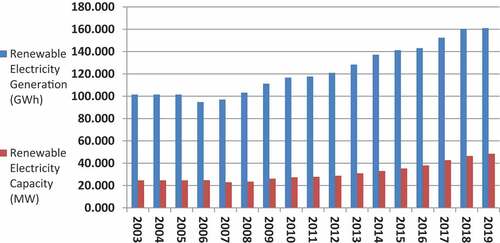
Table 1. Descriptive statistics
Table 2. Correlation matrix
Table 3. Result of Pesaran’s test (Citation2004) cross-sectional Independence
Table 4. Result of Frees’s test (Citation1995, Citation2004) cross-sectional Independence
Table 5. Results of Harris-Tzavalis panel unit-root test
Table 6. Results of Pesaran (CIPS) panel unit-root test
Table 7. Results of OLS and random effects panel models
Table 8. Lag selection-order criteria
Table 9. Panel VAR-Granger causality Wald test
Table 10. Result of heteroskedasticity-robust Born and Breitung (Citation2016) HR-test
Table 11. Result of variance inflation factor
Table 12. Panel vector autoregresssion. GMM Estimation. Final GMM Criterion Q (b) = 1.86e-33. Initial weight matrix: Identity. GMM weight matrix: Robust
Table 13. Random effects and OLS estimation
Figure 4. Plot of cumulative sum of recursive residuals.