
Figures & data
Figure 1. Map of the study areas.
Source: Ethio GIS and CSA (2007)
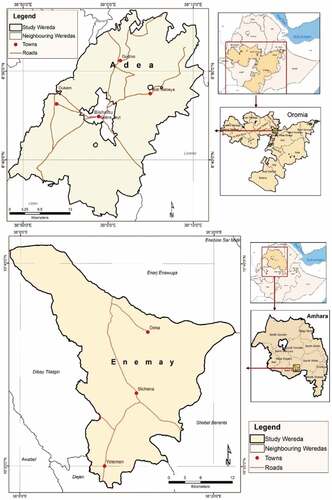
Table 1. Descriptive statistics
Table 2. Mean values of the cereal output, input variables and stress incidence by crop type
Table 3. Improved technologies adoption by crop type
Table 4. Intensity of adoption by crop type
Table 5. Maximum likelihoods estimate of the parameters for SFPF model
Table 6. Meta-level technical efficiency by technology adoption status of farm households
Figure 2. Efficiency distribution by adoption of HYVs.
Source: Authors’ analysis using primary data (2020)
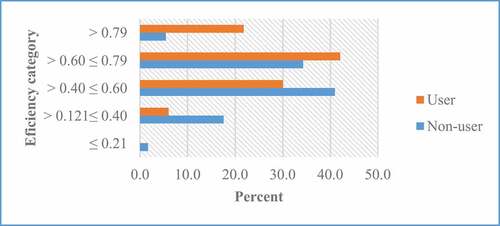
Table 7. Factors explaining efficiency of smallholder farm households
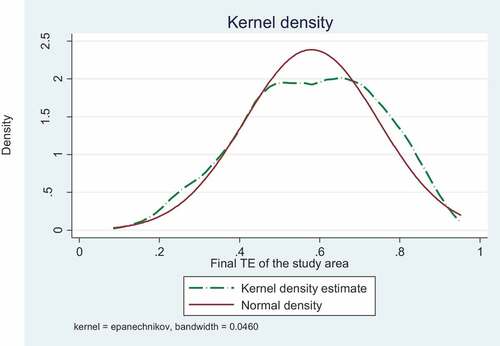
Figure D1. Kernel density distribution of technical efficiency.
Source: Authors’ analysis using primary data (2020)
Data Availability Statement
The data used for the study are available from the corresponding author upon request.