
Figures & data
Figure 1. S-shaped diffusion curve. Source: Adapted from (Rogers, Citation2003)

Figure 2. Diffusion innovation theories. Source: (Roger 2003)
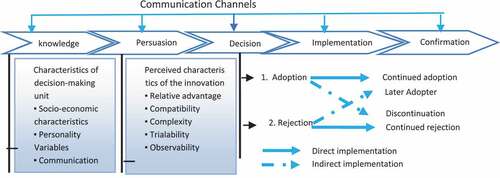
Figure 3. Theory of reasoned action. Source: Ajzen and Fishbein (Citation1975)
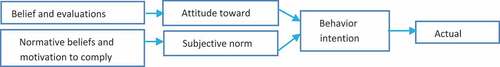
Figure 4. Location map of the study area.Source: Ethio Geo-spatial data
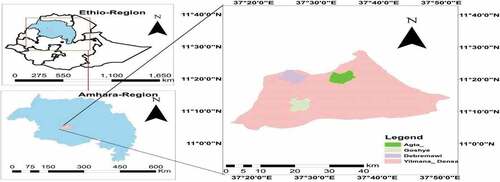
Table 1. Independent t-test for continuous explanatory variables
Table 2. Chi-square test for categorical explanatory variables
Table 3. Estimates of double hurdle model for adoption of Tef production technology
Table A1. Weights and methods of rating to calculate intensity of adoption
Table A2. Omitted variable test using Ramsey reset for 2nd hurdle
Table A3. Multicollinearity test using vif for 1st hurdle (probit) variables
Table A4. Breusch-Pagan/Cook-Weisberg test for heteroscedasticity for 2nd hurdle
Table A5. Multicollinearity test using VIF for 2nd hurdle (Truncated) variables
Table A6. Collinearity test for 1st hurdle (Probit) categorical variables
Table A7. Collinearity test for 2nd hurdle (Truncated) categorical variables
Table A8. Tobit model vs. Double-Hurdle model
Table A9. Independent double hurdle vs Heckman two-stage model
Table A10. Recommended fertilizer rate for some Ethiopia districts
Table A11. Recommended management practices for tef production