
Figures & data
Table 1. Descriptive statistics of the panel data
Table 2. Results of the backtesting of VaR-t at both the 95% and 99% confidence level
Table 3. Results of the backtesting of VaR-log at both the 95% and 99% CL
Table 4. Results of the backtesting of the VaR- EWMA distribution at both 95% and 99% CL
Table 5. Results of the backtesting of the VaR-GARCH(1,1) distribution at the 95% & 99% CL
Table 6. Results of backtesting of VaR- historical distribution at 95% and 99% CL
Figure 1. Comparative forecasting performance of the VaR models for selected funds at the 95% and 99% levels.
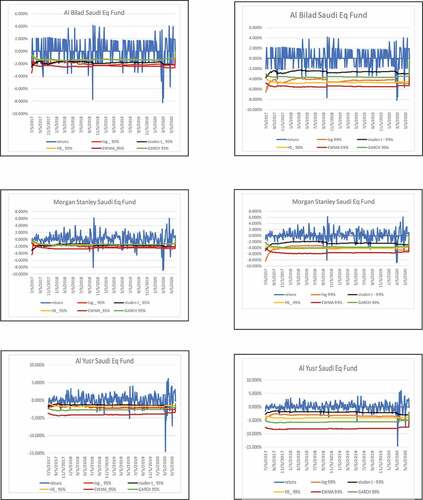
Table 7. VaR performance under Quadratic Loss and Unexpected Loss functions at a 95% confidence level
Table 8. VaR performance under quadratic loss and unexpected loss functions at the 99% confidence level