
Figures & data
Figure 1. Impulse response graphs for first time period for oil exporting countries.Source. Authors.
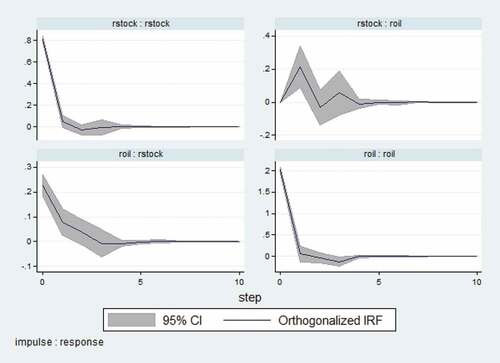
Figure 2. Impulse response graphs for second time period for oil exporting countries.Source. Authors.
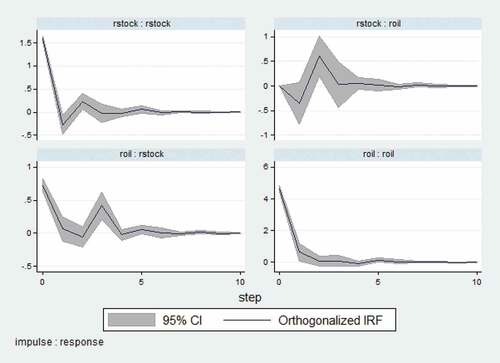
Figure 3. Impulse response graphs for first time period for oil importing countries.Source. Authors.
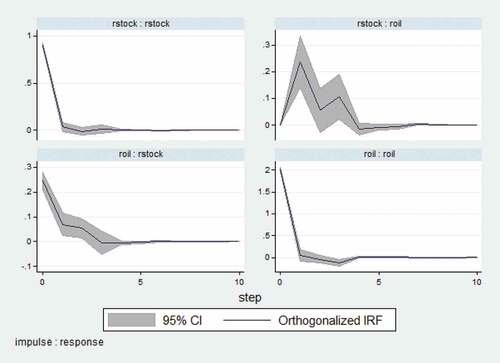
Figure 4. Impulse response graphs for second time period for oil importing countries.Source. Authors.
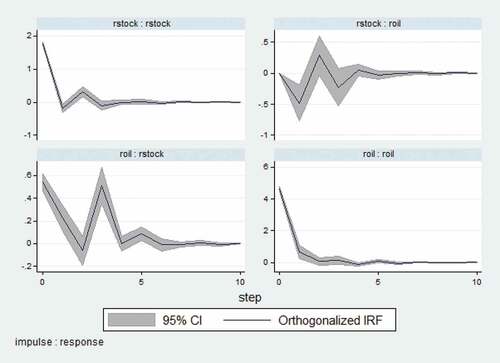
Table A1. Average levels of stock price and crude oil
Table A2. Descriptive statistics for oil exporting countries and crude oil
Table A3. Descriptive statistics for stock index returns of oil importing countries
Table A4. Results of panel unit root test
Table A5. Results of granger-causality
Table A6. Forecast error variance decomposition
