Figures & data
Figure 1. P/YTM charts for a typical coupon bond (blue thick line) and a bond artificially created (red thin line) by theoretical construction. These two bonds form an arbitrage portfolio. “Price(crcy)” means price in a certain currency.
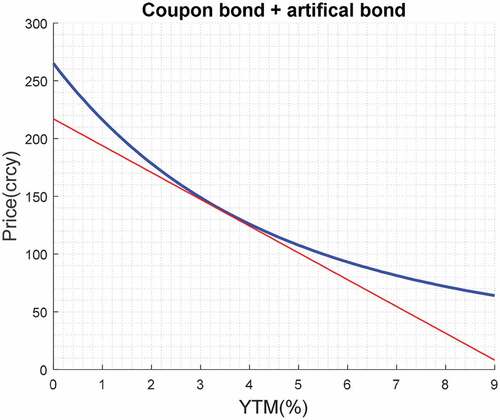
Figure 2. Possible development of YTM.
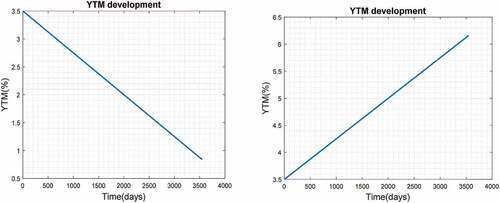
Figure 3. Cumulative P/L for portfolio 1 and for portfolio 2 in subfigures a), b); absolute value of cumulative P/L for portfolio 1 and for portfolio 2 in subfigures c), d); total cumulative P/L of both portfolios in subfigures e), f). Subfigures a), c), e) are for the case that YTM develops according to -left, subfigures b), d), f) are for the case in -right. “PL(crcy)” means PL in a certain currency.
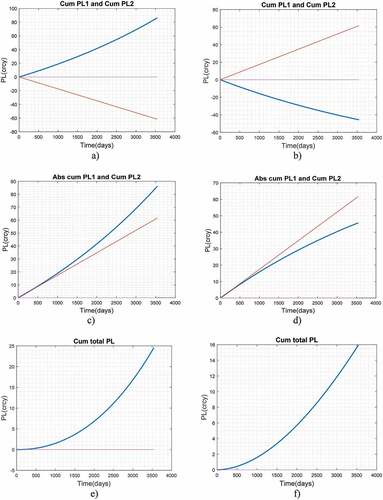
Figure 4. Possible development of YTM.
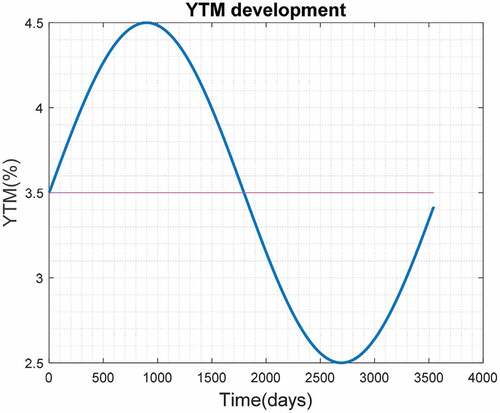
Figure 5. Cumulative P/L on long portfolio 1(blue thick line) and short portfolio 2(red thin line) (left), cumulative P/L in absolute values (right). “PL(crcy)” means PL in a certain currency.
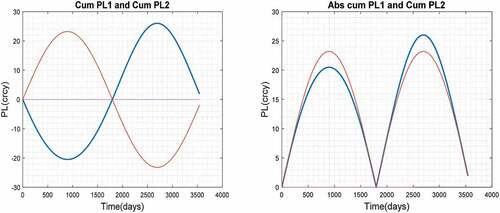
Figure 6. Total cumulative P/L of a convexity arbitrage strategy. “PL(crcy)” means PL in a certain currency.
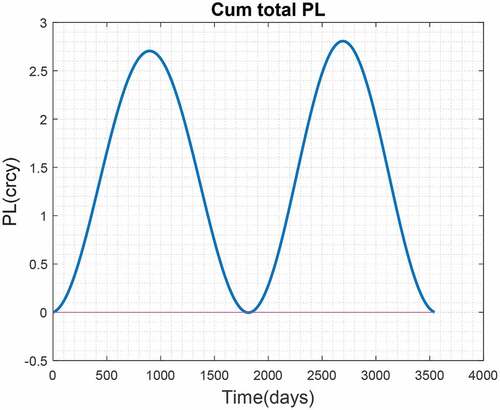
Figure 7. P/YTM charts of two portfolios, the first of which consists of one zero-coupon bond (blue thick line) and the second of two zero-coupon bonds (red thin line). “Price(crcy)” means price in a certain currency.
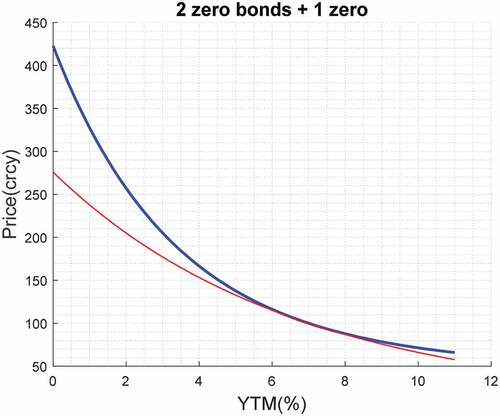
Figure 8. P/YTM charts of two portfolios, both of them consist of one zero-coupon bond. “Price(crcy)” means price in certain currency.
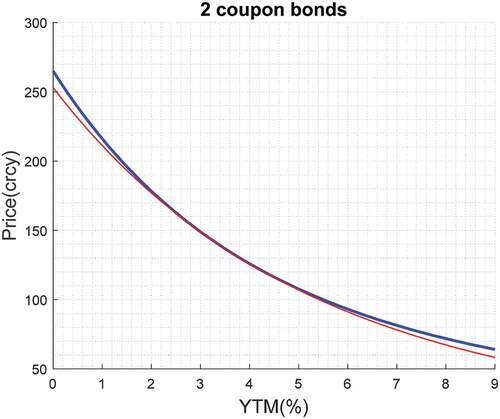
Figure 9. Daily shape changes of USD zero-coupon yield curve, period 1999–2018 (4900 working days), source: Reuters.
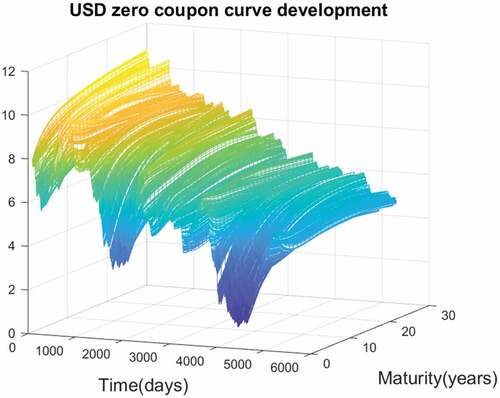
Figure 10. Cumulative P/L on long portfolio 1(blue thick line) and short portfolio 2 (red thin line), (left) and total cumulative P/L (right) during back-testing of convexity arbitrage strategy. “PL(crcy)” means PL in a certain currency.
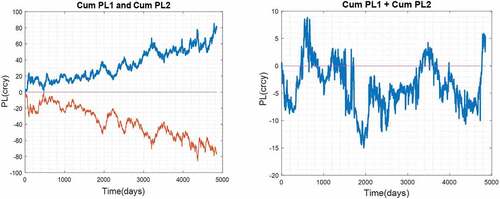
Figure 11. Schematic representation of the expected development of total cumulative P/L of portfolio 1 and portfolio 2 in case that convexity arbitrage works properly during back-testing. “PL(crcy)” means PL in a certain currency.
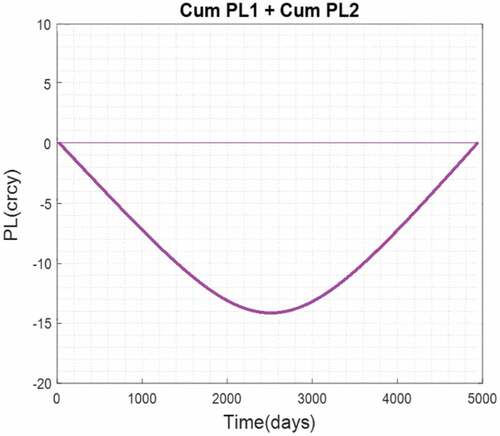
Figure 12. Daily shape changes of EUR zero-coupon yield curve, period 2004–2018 (3500 working days) source: Reuters.
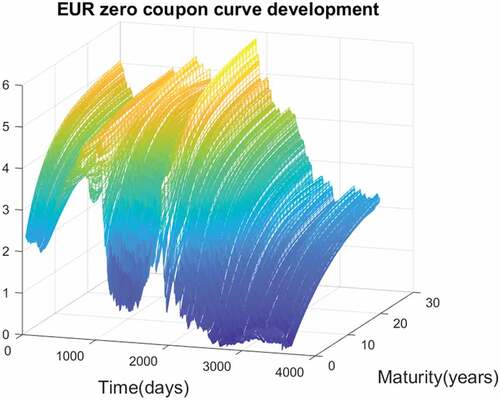
Figure 13. Cumulative P/L on long portfolio 1(blue thick line) and short portfolio 2 (left) and total cumulative P/L (right) during back-testing of convexity arbitrage strategy. “PL(crcy)” means PL in a certain currency.
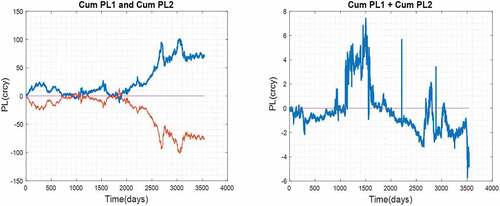
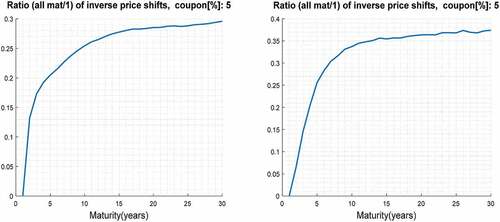
Figure 14. Ratio of number of inverse price shifts for bond with maturity = 1 year with respect to bonds with maturities of 1–30 years (fixed coupon rate bonds) for USD (left) and for EUR (right); the figures demonstrate that the presumption of parallel YTM shifts is empirically only partly fulfilled.