
Figures & data
Figure 1. Livelihood framework: irrigation and land-use selections. Source: Modified from Scoones (Citation1998) and (Nguyen et al., Citation2017).
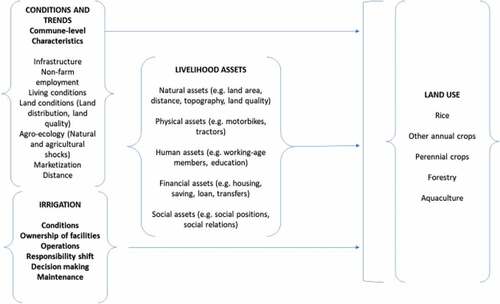
Figure 2. Site surveys. Source: Authors’ creation.
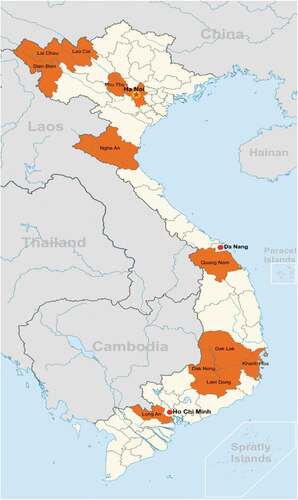
Table 1. Comparison of household-level characteristics, 2008–2016
Table 2. Comparison of commune-level characteristics, 2008–2016
Table 3. Comparison of commune-level characteristics of irrigation, 2008–2016
Table 4. Average farmland area (ha) and land-use types, 2008–2016
Table 5. Irrigation and land-use choices: Basic model (Panel A)
Table 6. Irrigation and land-use choices: Irrigation physical conditions (Panel B1)
Table 7. Irrigation and land-use choices: Ownership of irrigation facilities (Panel B2)
Table 8. Irrigation and land-use choices: Irrigation operations (Panel B3)
Table 9. Irrigation and land-use choices: Management responsibility shift (Panel B4)
Table 10. Irrigation and land-use choices: Decision-making (Panel B5)
Table 11. Irrigation and land-use choices: Irrigation maintenance (Panel B6)