
Figures & data
Table 1. Hidden economies in Jordan and Middle Eastern Countries
Figure 1. The MIMIC model. source: .Schneider and Buehn (Citation2013)
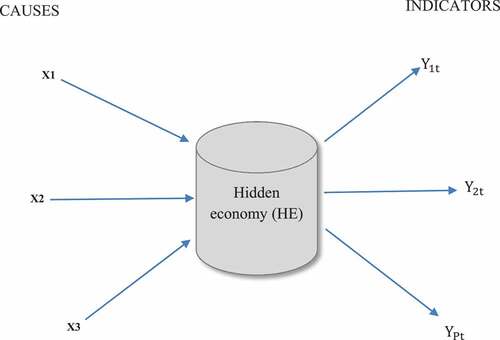
Table 2. The MIMIC model results for Jordan’s economy from 1980–2018
Table 3. The size of the hidden economy as a percentage of GDP
Figure 2. Trends in the hidden economy in Jordan GDP (%).
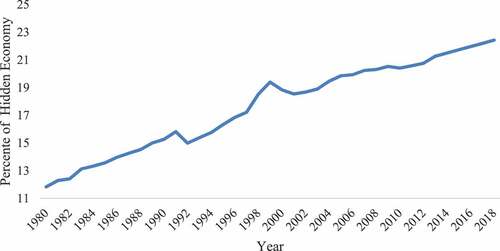
Figure 3. Trends in the value of jordan’s hidden economy (Million Jordanian Dinar).
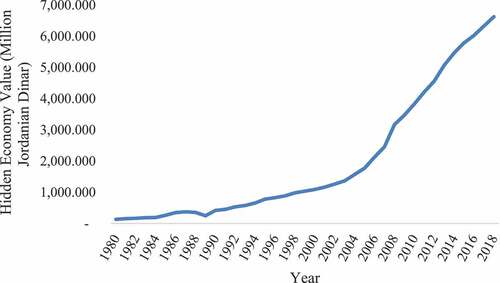
Figure 4. Trend in the hidden economy of Jordan and the GDP growth rate.
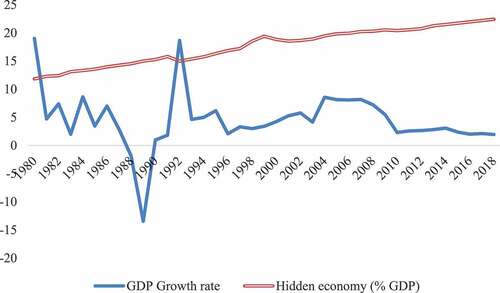
Table 4. Comparison of the estimated hidden economy in Jordan according to various studies % of GDP
Figure 5. Comparison of the estimated hidden economy in Jordan according to various studies (% of GDP).
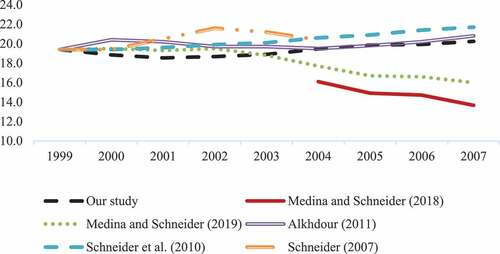
Table 5. Summary of results
Table 6. The MIMIC model results
Table A1. Causes of the hidden economy
Table A2. Indicators of the hidden economy
Table A3. ADF test for the MIMIC approach variables