
Figures & data
Table 1. Number of human victims of natural disasters in Indonesia 1969–2015
Table 2. Economic damages caused by natural disasters in Indonesia 1990–2015
Table 3. Damage facilities at village level caused by natural disaster
Figure 1. Household experiences of disaster (N = 12,987).Source: Author’s calculation based on IFLS4
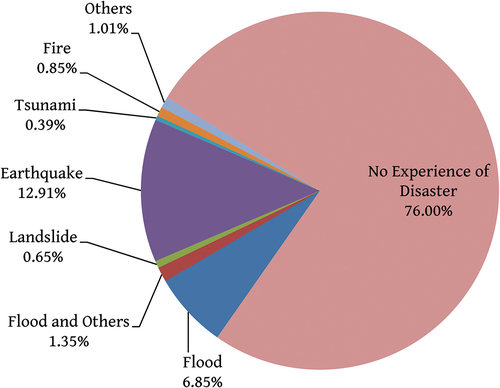
Table 4. Cross-tabulation between disaster experience and poverty status in 2007
Figure 2. Types of village preparedness for natural disasters (N = 125).Source: Author’s calculation based on IFLS4
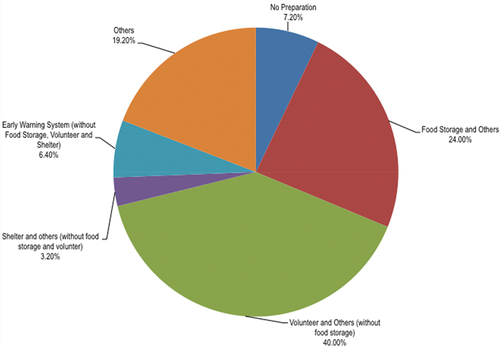
Table 5. The impact of disaster on household consumption and poverty in 2007
Table 6. Marginal effects of the impact of disaster on changing poverty status during 2000–2007 (ordered logit model (model 3))