
Figures & data
Figure 1. Trade balance between Ghana and key trading partners in the period of 2013 to 2018.Source: Author, computed based on the data from (Wits.worldbank.org, 2021).
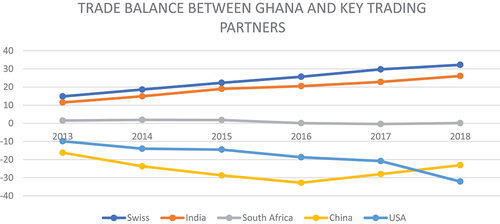
Figure 2. The J curve after depreciation/devaluation source: Levi (2005).
Figure 3. Plots of cumulative sum of recursive residuals (CUSUM) and cumulative sum of squares of recursive residuals (CUSUMSQ).Panel A: China Panel B: Swiss
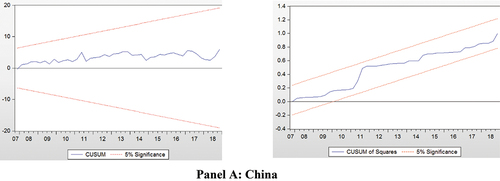
Figure 3. (Continued.)
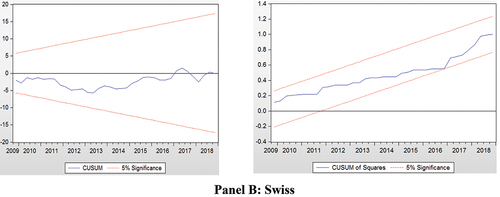
Table 1. Test for unit root
Table 2. Bounds test
Table 3. ARDL model results
Table 4. Diagnostic tests results