
Figures & data
Figure 1. Comparison of industry value-added of selected regions in the world in current US$.
Source: Author’s Sketch using data from World development indicators (2021)
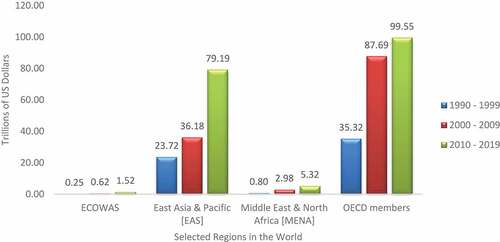
Table 1. Variable definition and measurement
Table 2. Descriptive statistics of variables employed
Table 3. Principal component eigen values & proportion for institutional quality index
Table 4. Correlation matrix of variables employed
Table 5. Hausman test result for models
Table 6. Cross-sectional dependence test
Table 7. Panel unit root test by Pesaran
Table 8. Kao test for cointegration
Table 9. Long-run fixed effect panel regression result with Driscoll and Kraay efficient standard errors and quantile regression
Table 10. Short run dynamic fixed effect regression result