
Figures & data
Figure 1. The daily returns of stock indices.
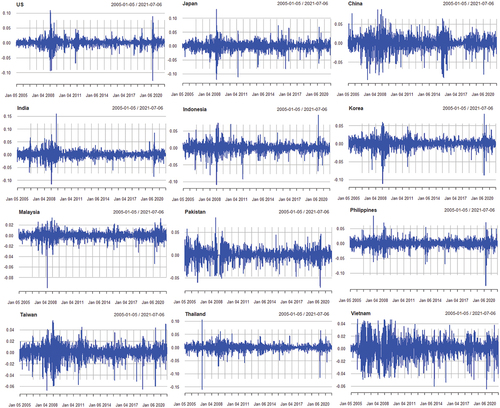
Table 1. Descriptive statistics of returns in the full period (from 1 January 2005 through 6 July 2021)
Table 2. Descriptive statistics of returns before and during the GFC (from 01/01/2005 to 31/12/2009)
Table 3. Descriptive statistics of returns before and during Covid-19 pandemic (from 01/01/2013 to 06/07/2020)
Figure 2. Conditional Correlation among U.S, Japan, China and Asian Countries .
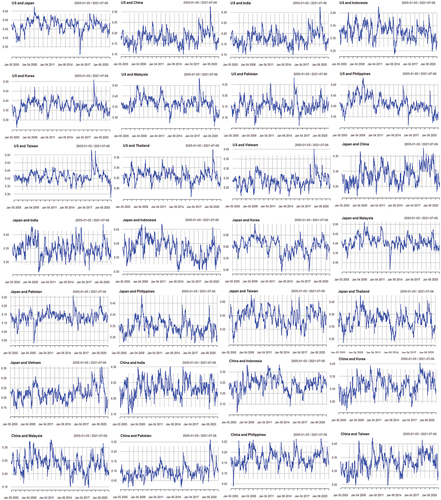
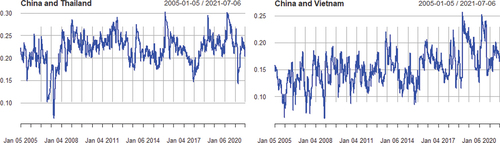
Table 4. Conditional correlation coefficients (from 1 January 2005 to 6 July 2021)
Table 5. The GFC period: conditional correlation coefficients
Table 6. The Covid-19 pandemic period: conditional correlation coefficients