
Figures & data
Figure 1. Response of TASI returns to the growth of COVID-19 new confirmed cases from March 2020 to December 2020. The authors estimated and analysed the variants in this figure.
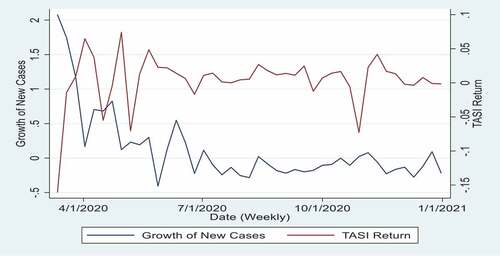
Table 1. Measurements of the risk factors in the Fama and French (Citation2015) five-factor model
Table 2. Summary statistics of the main variables
Table 3. Pairwise correlations between mutual fund returns and other variables
Table 4. Summary statistics of the weekly Fama-French five-factor model, March 2020 to December 2020
Table 5. OLS-regression of the fund excess return on the Fama-French five-factor model, March 2020 to December 2020
Table 6. Pooled-OLS regression of funds unadjusted return on CWI and CWF
Table 7. Pooled-OLS regression of fund risk-adjusted returns on growth in CWI and CWF
Table 8. Entity-and-time fixed effect regression model of funds unadjusted return, and funds risk-adjusted return on CWI and CWF
Table 9. The impact of COVID-19 outbreak on returns of the market and the 79 mutual funds
Figure 2. Time series returns’ movements for all sectors in the Saudi market from March 5th to December 31st, 2020. The authors estimated and analysed the variants in this figure.
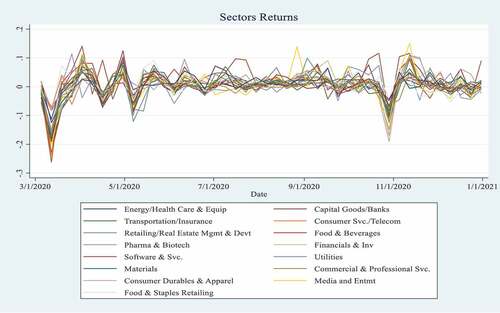
Table A1. Summary statistics for weekly returns for 20 sectors’ indices in the Saudi stock exchange (TASI) between 5th March and 31st Dec 2020