
Figures & data
Figure 1. Top: The effect of a credit limit increase on utilisation rate (UT).
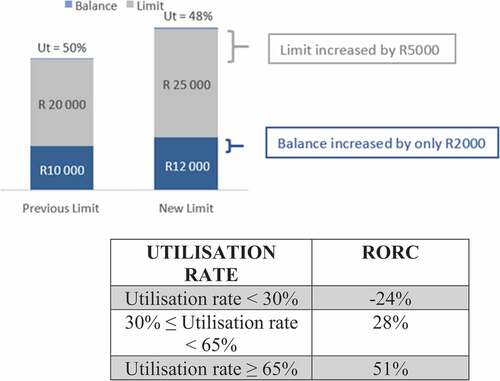
Table 1. Illustration of the interpretation of the CCLU measure
Figure 2. Distribution of CCLU values when the definition is applied to real data.
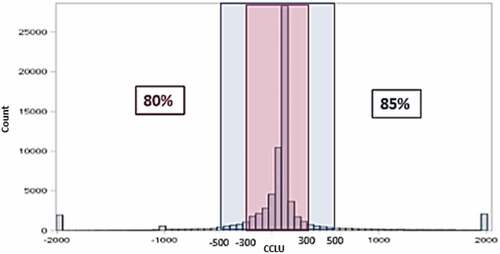
Table 2. Variables selected for the different modelling techniques
Table 3. Result comparison of utilisation rate models
Table 4. Result comparison of best utilisation rate model and CCLU value model
Figure 3. Comparison of actual and predicted utilisation rates in panels (a), (c), (d) and CCLU values in panels (b), (e) and (f).
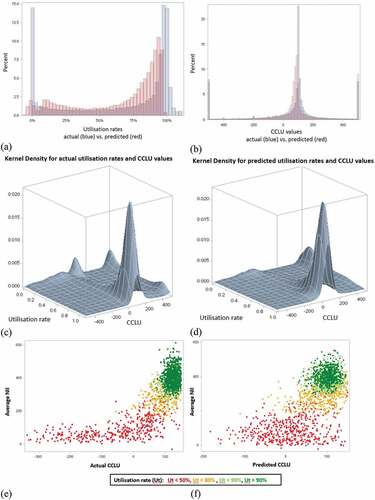
Table 5. Illustration of the effect of using CCLU values to inform limit-setting strategies
Table A1. Summary of the factors (and examples of their underlying characterising) influencing credit card utilisation
Table C1. List of the 22 variables available for model purposes