Figures & data
Figure 1. International business sector primary income and value added shares,%, for OECD countries. Source: Authors’ drawing based on OECD statistics and the World Bank database.
Figure 2. International business sector primary income and value added shares, %, for top non-OECD countries.Source: Authors’ drawing based on OECD statistics and the World Bank database.
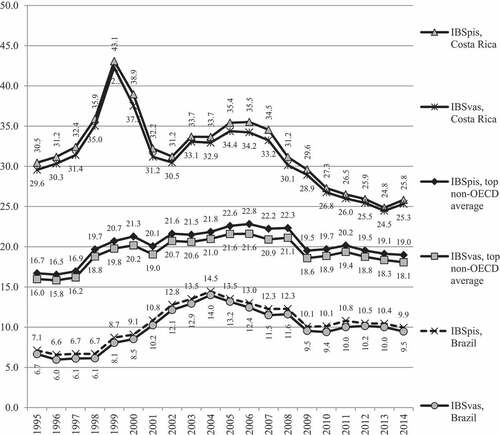
Figure 3. IBSPIS growth rate, OECD, top non-OECD countries, India and Germany, total and average, 1995 is a base year.Source: Authors’ drawing based on OECD statistics and the World Bank database.
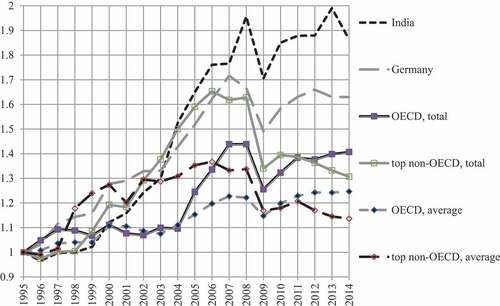
Figure 4. Structure of IBS: (a) average for OECD countries;(b) average for top non-OECD countries.Source: Authors’ drawing based on OECD statistics and the World Bank database.
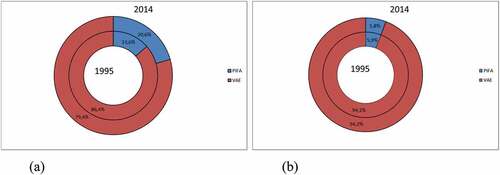
Figure 5. Primary income from abroad (received) share in the IBS, in OECD countries.Source: Authors’ drawing based on OECD statistics and the World Bank database.
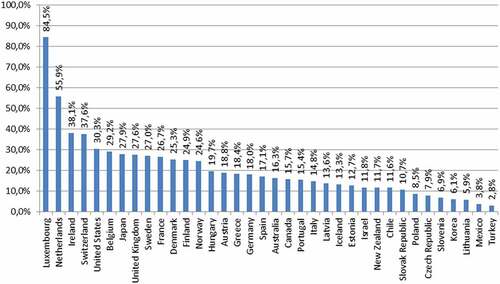
Figure 6. Primary income from abroad (received) share in the IBS, in top non-OECD countries.Source: Authors’ drawing based on OECD statistics and the World Bank database.
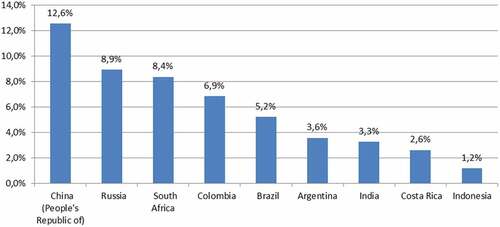
Figure 7. IBS gap between OECD and top non-OECD countries (%).Source: Authors’ drawing based on OECD statistics and the World Bank database.
Table 1. IBS values corresponding to the maximum density of functions
Figure 8. The elbow method using inertia for clustering of OECD countries.Source: Authors’ drawing based on authors’ computations in reliance on OECD statistics and the World Bank database.
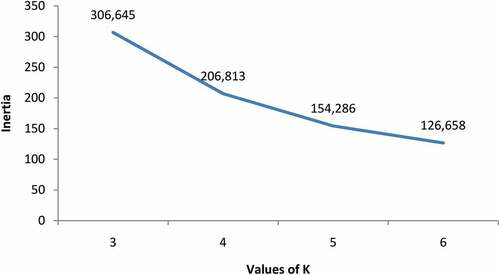
Table 2. Comparison between clustering and grouping of OECD countries in 2014
Figure 9. Dynamics of groups of OECD countries on the base of adjusted results of clustering.Source: Authors’ drawing based on OECD statistics and the World Bank database.
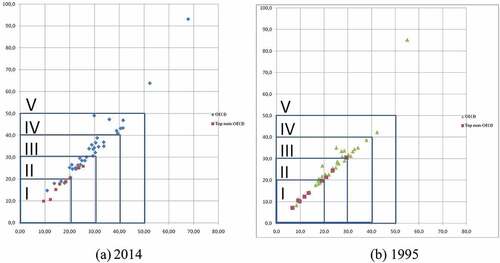
Figure 10. Two-decade dynamics (internationalization wave) of OECD countries’ IBS models.Source: Authors’ drawing based on OECD statistics and the World Bank database.
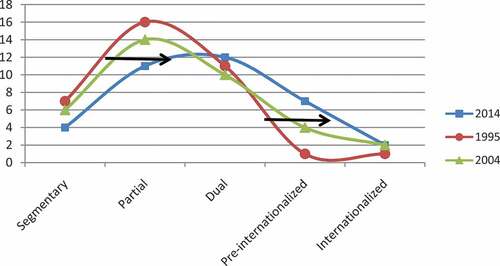
Figure 11. Difference in the balance of number of countries with partial and dual IBS models, in the first and second decades of the analyzed period.Source: Authors’ drawing based on OECD statistics and the World Bank database.
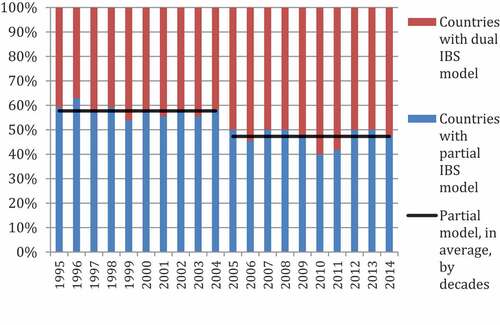
Table A1. Comparison of traditional and IBS-based total debt service estimations
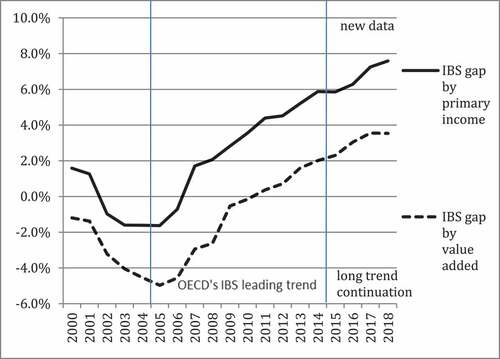
Figure A1. Continuation of OECD’s IBS leading trend in 2015-2018. IBS gap between OECD an top non-OECD countries (%). Source: Authors’ drawing based on OECD statistics and the World Bank database.