
Figures & data
Table 1. Descriptive statistics and preliminary tests of the data and oil market structural shocks
Table 2. GJR-GARCH model estimates
Figure 1. The impulse response of global oil price to structural oil shocks (11 February 2000 to 12 February 2021).Note: Figure shows the impulse response of global oil price to structural oil shocks for 20 periods.
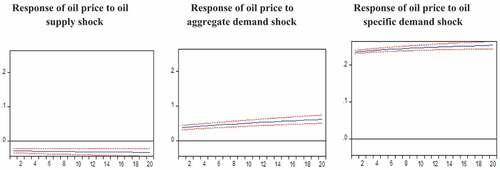
Figure 2. Responses of returns volatility to structural shocks (11 February 2000 to 12 February 2021).Notes: shows the estimated response of the daily conditional volatility of BRICS and G7 markets returns to daily structural shocks between 11 February 2000 and 12 February 2021. They are based on a recursive-design wild bootstrap with 2000 replications (Gonc¸ & Kilian, Citation2004).
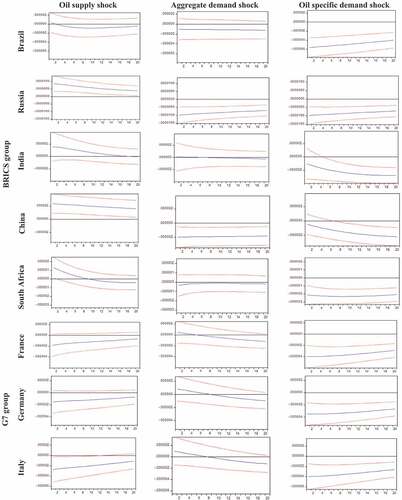
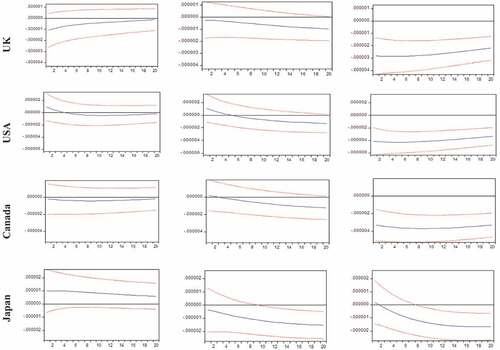
Table 3. Variance decomposition- returns volatility
Table 4. Variance decomposition- returns volatility for different lags