
Figures & data
Figure 1. CO2 emissions (metric tons per capita) in the Gulf Cooperative Council 2000 to 2016.Source: World Development Indicators, World Bank
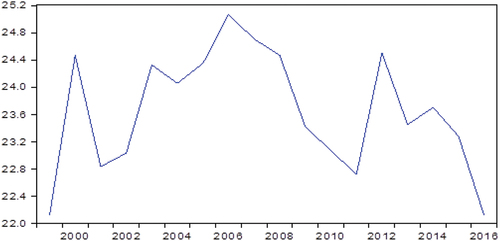
Figure 2. Foreign direct investment inflows to the Gulf Cooperative Council of Countries 2000 to 2016.Source: United Nations Conference on Trade and Development (UNCTAD)
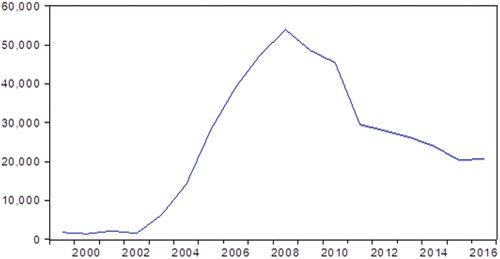
Figure 3. West Texas Intermediate crude oil prices 2000 to 2016.Source: Federal Reserve Economic Data
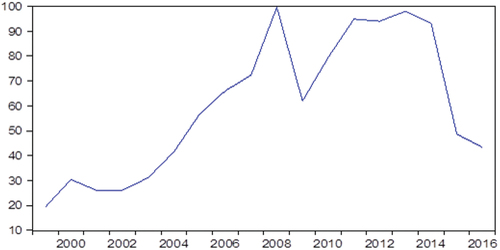
Table 1. Description of the variables used in the study for the period 1999 to 2016
Table 2. Summary statistics of the variables for the period 1999 to 2016
Table 3. Panel unit root tests of the variables for the period 1999 to 2016
Table 4. Linear panel ARDL results of the variables for the period 1999 to 2016
Table 5. Foreign direct investment and CO2 emissions (panel NARDL analysis results) of the variables for the period 1999 to 2016
Table 6. Oil pricesOil prices and CO2 emissions and CO2 emissions (panel NARDL analysis results) of the variables for the period 1999 to 2016