
Figures & data
Figure 1. Electricity production from renewable resources (hydropower and other sources), a comparison.
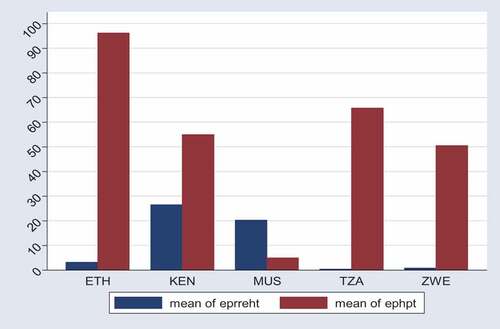
Figure 2. Time trends of electricity production from renewable resources excluding hydropower by country.
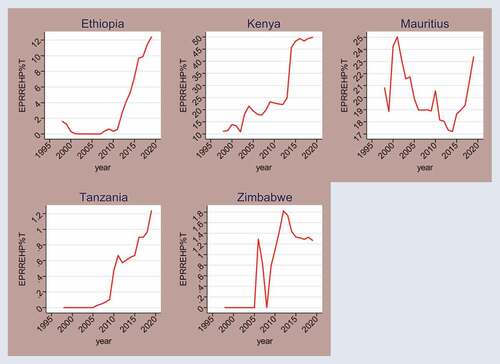
Table 1. Stationary test statistics of variables used in this study
Table 2. Model selection among the pooled mean group, mean group, and dynamic fixed effect
Table 3. Long- and short-run panel ARDL estimation results of pooled mean group model