
Figures & data
Figure 1. Paths of the process X(t) with and without jumps.
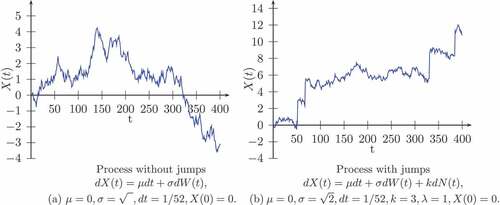
Figure 2. Graph of the negative of the marginal log-likelihood evaluated as a mixture of 5, 10, and 30 components.
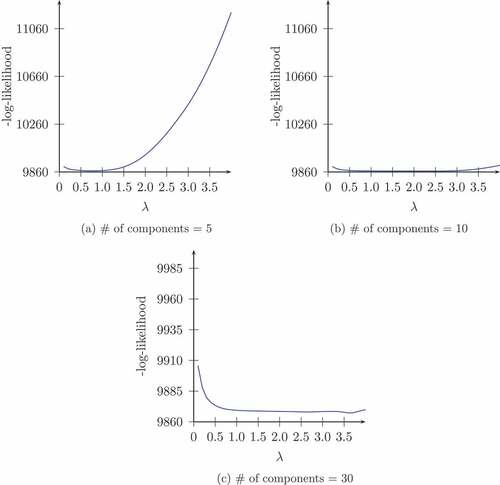
Figure 3. Histograms of the estimates of the parameters of the jump-diffusion process.
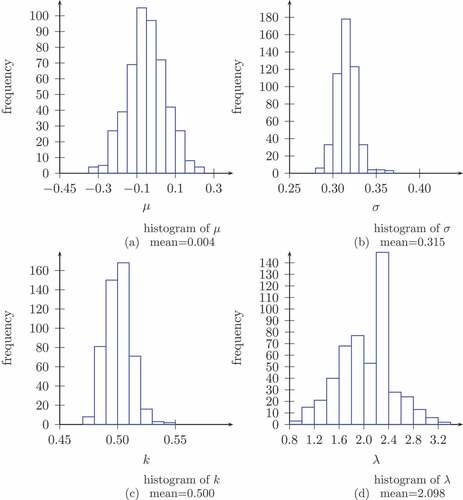
Table 1. Summary statistics
Table 2. Estimates of the parameters of the fundamental process for Canada and Japan
Table 3. Estimates of for Canada and Japan