Figures & data
Figure 1. Time evolution of the first four moments of equity, gold, and oil returns.
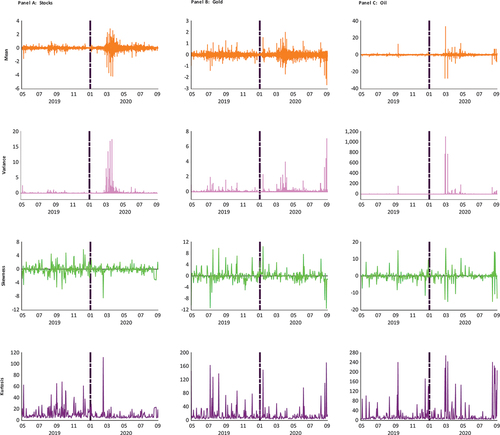
Table 1. Summary statistics and unit root tests
Table 2. Correlation coefficients during the pre-pandemic period
Table 3. Correlation coefficients during pandemic period
Figure 2. Continuous wavelet power spectra of the moment time series.
Notes: This figure shows the Morlet wavelet power spectra of the individual time series. Vertical and horizontal axes indicate the frequency bands and investigation period in days, respectively.
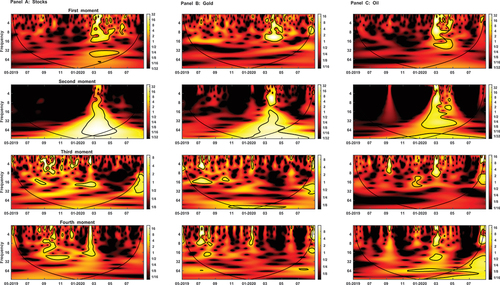
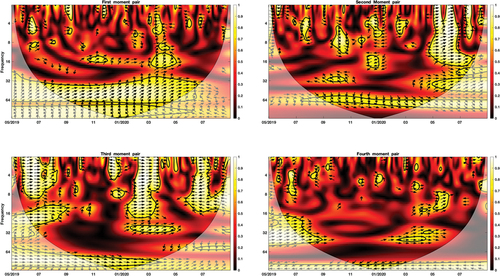
Figure 3. Cross-wavelet coherence of the first four moment pairs of stock and gold returns.
Notes: This figure depicts the wavelet coherence and phase-difference between each of the first four moment pairs of stock and gold returns. Vertical and horizontal axes show the frequency bands and investigation period in days, respectively.
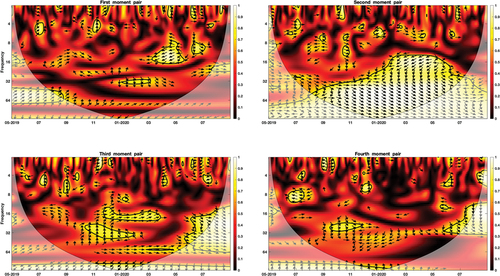
Figure 4. Cross-wavelet coherence of the first four moment pairs of oil and stock returns.
Notes: This figure depicts the wavelet coherence and phase-difference between each of the first four moment pairs of oil and stock returns. Vertical and horizontal axes show the frequency bands and investigation period in days, respectively.