
Figures & data
Figure 1. GDP growth rate in Kenya (1980–2017).Source: Author’s based on World Bank World Development Indicators database 2019
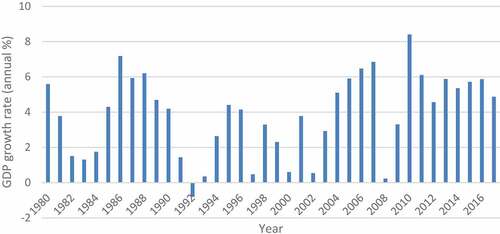
Figure 2. Foreign capital flows to Kenya in millions (Current US$).Source: Author’s based on World Bank World Development Indicators database 2019
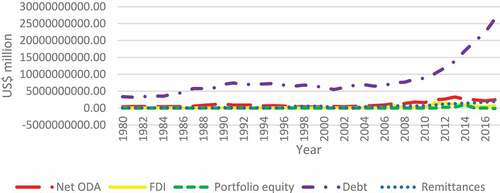
Figure 3. Foreign capital flows to Kenya in millions (Current US$) (without debt stock).Source: Author’s based on World Bank World Development Indicators database 2019
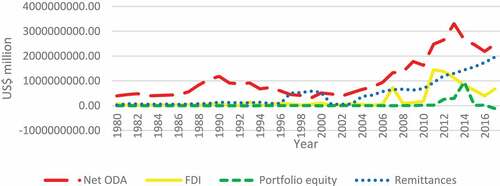
Figure 4. Foreign capital flows to Kenya as % of GDP.Source: Author’s based on World Bank World Development Indicators database 2019
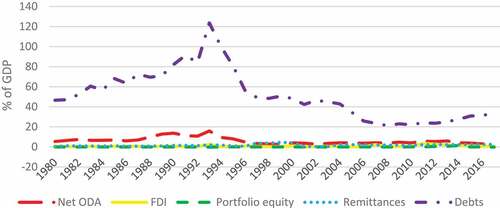
Figure 5. Foreign capital flows to Kenya as % of GDP (without debts).Source: Author’s based on World Bank World Development Indicators database 2019
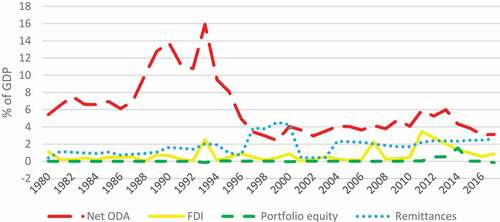
Table 1. ADF unit root test results
Table 2. Breakpoint unit root test results
Table 3a. ARDL Bounds test results: Economic growth as dependent variable
Table 3b. ARDL Bounds test results: Capital flows as dependent variable
Table 4. Pairwise Granger causality test
Table 5. ARDL/short-run results—economic growth (Y) as dependent variable
Table 6. ARDL/long-run error correction modelling results—economic growth (Y) as dependent variable