
Figures & data
Figure 1. Map of the study area: (a) map of Ethiopia, (b) map of SNNPR, (c) map of Gedeo zone.
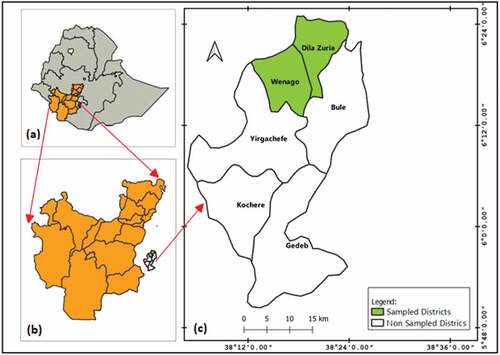
Table 1. Sample households
Table 2. Variable description, measurement, and expected signs
Table 3. Sample of the study
Table 4. Descriptive statistics of household characteristics (Continuous variables)
Table 5. Descriptive statistics of household characteristics (dummy variables)
Table 6. Logistic regression results
Table 7. Distribution of estimated propensity scores
Table 8. Matching algorithm result
Table 9. Propensity score and covariate balance test
Figure 2. The propensity score distribution for balancing tests before and after matching.
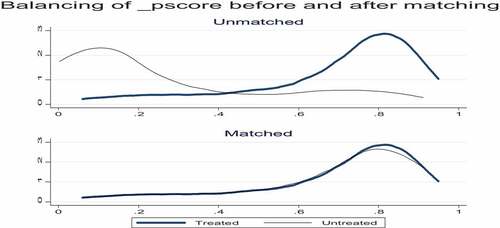
Table 10. Chi-square test for the joint significance of variables
Table 11. Average treatment effect on the treated (ATT) results
Table 12. Rosenbaum bound for outcome for daily calorie consumption/AE