
Figures & data
Figure 1. Assuming no oscillation amplitude , the empirical price
, logistic growth
, Gompertz growth
, charged capacitor growth
, combined logistic and charged capacitor growth
and
, and combined Gompertz and charged capacitor growth
and
, for 23 July 2010–21 June 2021 (panels a and c) and until 1 January 2100 (panels b and d),
. Panels a and b apply the least squares method. Panels c and d apply the weighted least squares method.
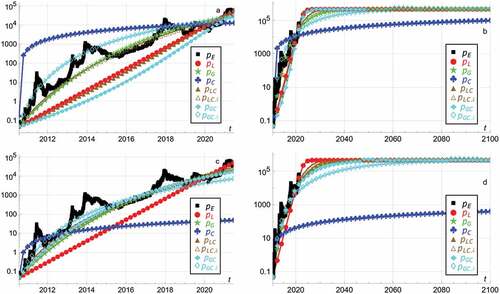
Figure 2. Assuming no oscillation amplitude , the empirical price
, logistic growth
, Gompertz growth
, charged capacitor growth
, combined logistic and charged capacitor growth
and
, and combined Gompertz and charged capacitor growth
and
, for 23 July 2010–21 June 2021 (panels a and c) and until 1 January 2100 (panels b and d),
. Panels a and b apply the least squares method. Panels c and d apply the weighted least squares method.
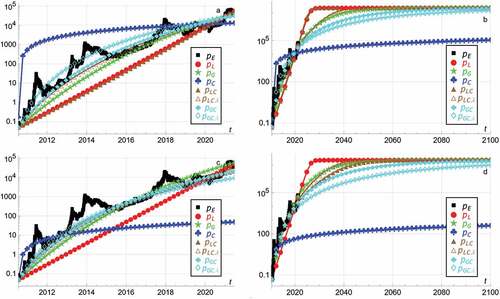
Figure 3. Assuming oscillation amplitude , the empirical price
, logistic growth
, Gompertz growth
, charged capacitor growth
, combined logistic and charged capacitor growth
and
, and combined Gompertz and charged capacitor growth
and
, for 23 July 2010–21 June 2021 (panels a and c) and until 1 January 2040 (panels b and d),
. Panels a and b apply the least squares method. Panels c and d apply the weighted least squares method.
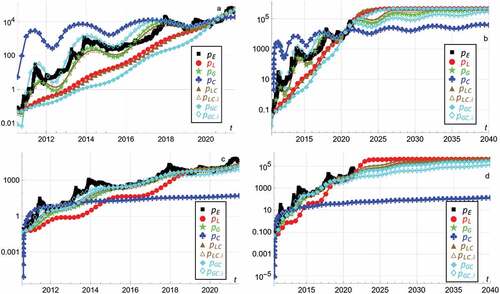
Figure 4. Assuming oscillations , the empirical price
, logistic growth
, Gompertz growth
, charged capacitor growth
, combined logistic and charged capacitor growth
and
, and combined Gompertz and charged capacitor growth
and
, for 23 July 2010–21 June 2021 (panels a and c) and until 1 January 2040 (panels b and d),
. Panels a and b apply the least squares method. Panels c and d apply the weighted least squares method.
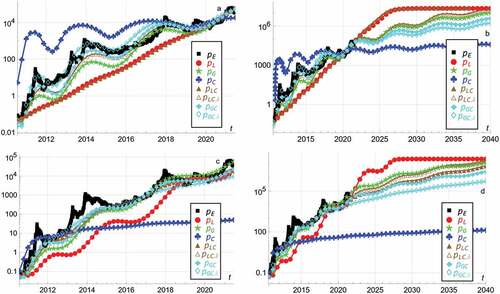
Table 1. Dates and magnitudes of bull market local maxima 4,5,6,7,8 when and
, predicted until year 2050
Table 2. Dates and magnitudes of bear market local minima 4,5,6,7,8 when and
, predicted until year 2050
Data availability statement
The article contains no associated data. All data generated or analyzed during this study is included in this published article.