
Figures & data
Figure 1. Number of confirmed COVID-19 cases (March 2020—April 2021).
Source: John Hopkins University- Center for Systems Science and Engineering (JHUCSSE, Citation2021) COVID-19 Data (2020–2021). Notes: The graph shows both upward and downward swings in the confirmed number of COVID-19 cases across the 4 countries. The highest cases were reported in November 2020, December 2020, January 2021, and February 2021 for Kenya, Uganda, Rwanda, and South Sudan respectively.
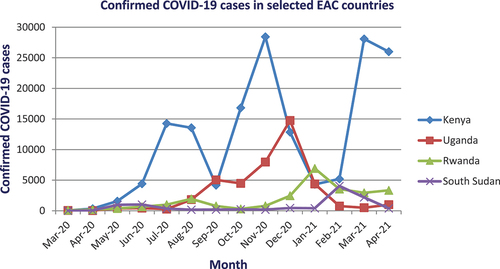
Table 1. Major country-specific fiscal/monetary government intervention measures
Table 2. General panel statistics
Table 3. Stationarity test results
Table 4. Pooled mean group (PMG) regression results-full model
Table A1. Different statistics per panel
Table A2. Pairwise correlation matrix