
Figures & data
Table 1. Descriptive statistics
Figure 1. Pearson correlation matrix for OIL, EX, CPI, UR, GDP and VNI in Vietnam.
Notes: the color bar represents the magnitude of the intensity for correlation between indicators.
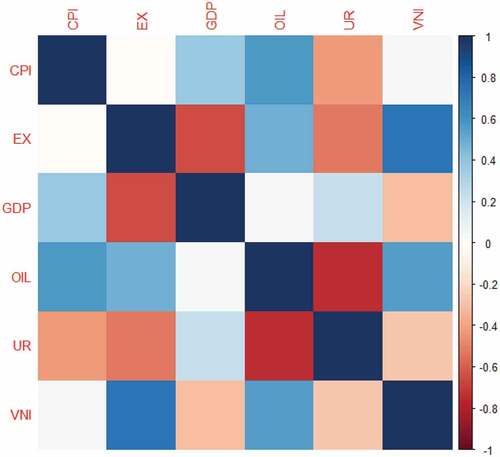
Table 2. Quantile autoregression unit root analysis
Table 3. Quantile cointegration test
Figure 2. (a) The impact of oil prices on inflation. (b) The impact of oil prices on exchange rate. (c) The impact of oil prices on economic growth. (d) The impact of oil prices on unemployment rate. (e) The impact of oil prices on stock market prices.
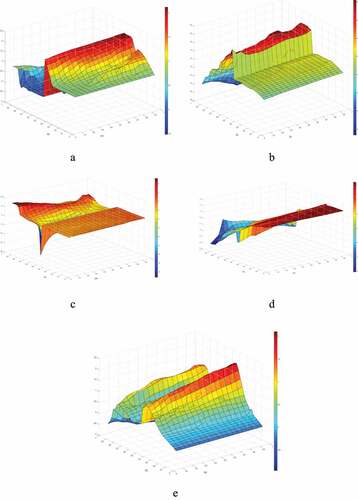
Table 4. Granger causality in quantile test results
Table 5. QRA estimates of oil prices and other indicators
Data availability statement
Please contact author for data and program codes requests. R and Matlab are used to organize data.