
Figures & data
Figure 1. Average poverty, net income Gini, revenue share, and expenditure share in developing countries, 1990–2014.
Source: Author’s calculation based on World Development Indicator, Standardized World Income Inequality Database, and Government Financial Statistics
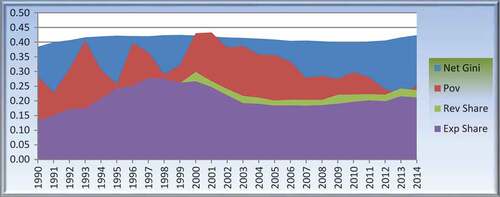
Table 1. List of variables
Table 2. Summary of statistics
Table 3. Regression on fiscal decentralization, poverty, and democracy
Table 4. Regression on fiscal decentralization, poverty, and quality of government
Table 5. List of developing countries