
Figures & data
Figure 1. Research design.
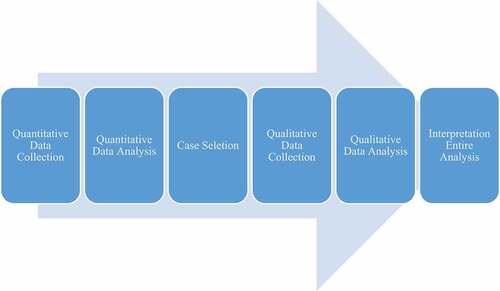
Table 1. Details of questionnaire distribution and response rate
Figure 2. Research Framework.
Table 2. Reliability test
Table 3. Descriptive statistic
Table 4. Correlation matrix
Table 5. Model 1 (Fraud Prevention as Dependent Variable)
Table 6. Model 2 (Fraud Detection as Dependent Variable)
Table 7. R adjusted square