
Figures & data
Table 1. Share of formal and informal activities in the agricultural sectors, 2014
Table 2. Household disaggregation by minimum wage
Table 3. Simulations of different scenarios for infrastructure investment
Figure 1. GDP growth path (%).
Source: The authors.
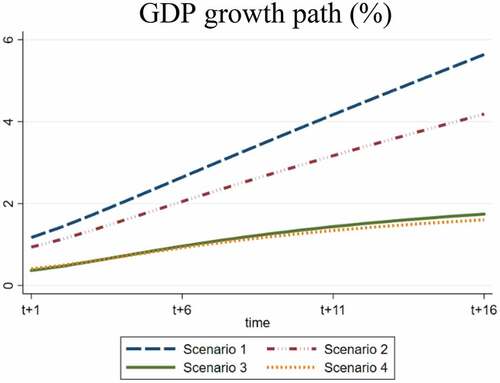
Figure 2. Government real income (%).
Source: The authors.
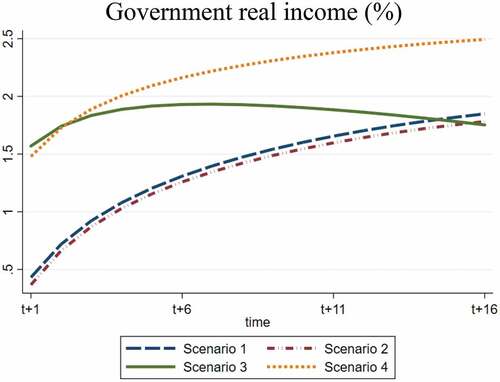
Figure 3. Public deficit (%).
Source: The authors.
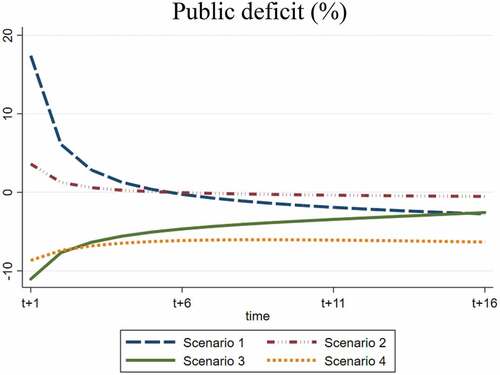
Figure 4. Private investment (%).
Source: The authors.
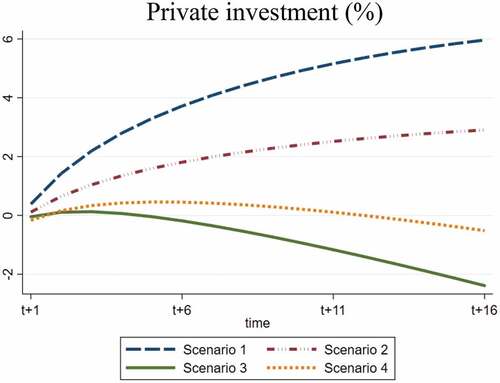
Table 4. Externalities and value-added (% in t + 16)
Table 5. Employment (% in t + 16)
Table 6. Household level impacts (% in t + 16)
Figure 5. Consumer price index.
Source: The authors.
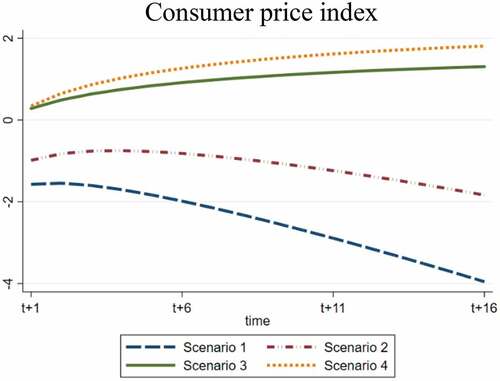
Table 7. Household saving (% in t + 16)
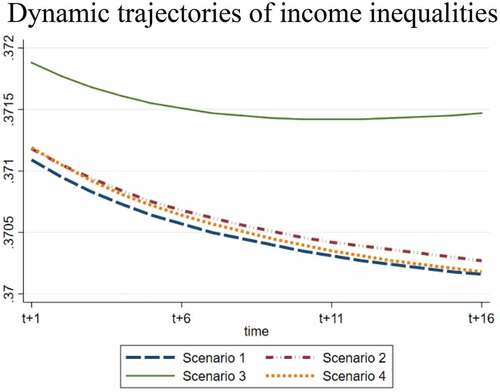
Figure 6. Dynamic trajectories of income inequalities.
Source: The authors.
Data availability statement
Data will be shared upon request.