
Figures & data
Figure 1. Trend of the variables.
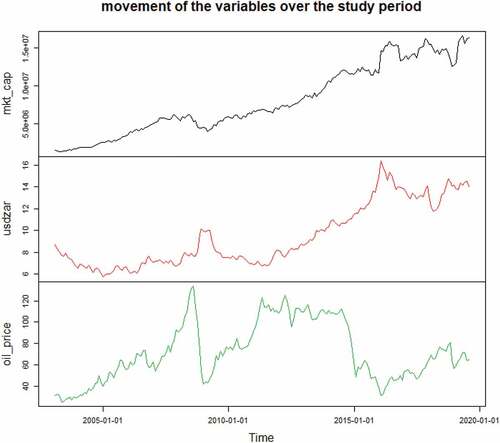
Figure 2. Histogram plots of the variables.
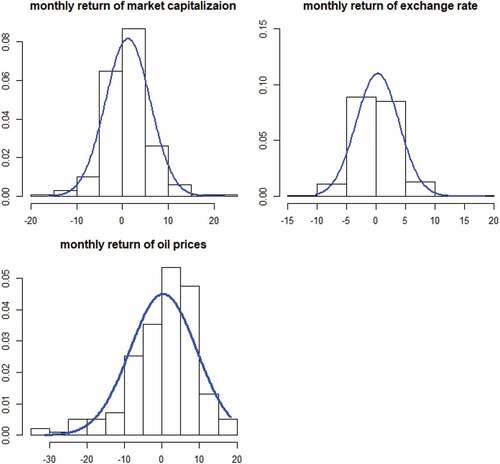
Table 1. Descriptive statistics of the variables
Figure 3. Static correlation chart of the variables.
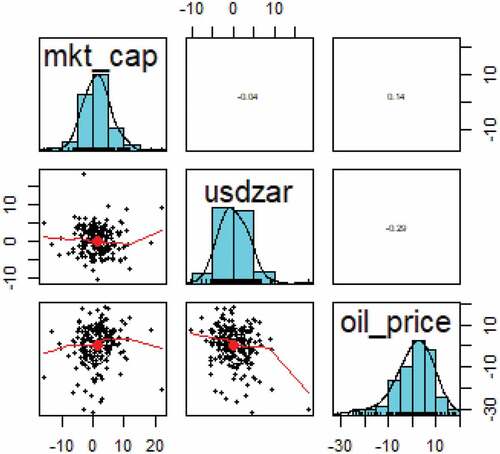
Table 2. Correlation matrix
Figure 4. Time-varying correlation among the variables.
Figure 5. Impulse response to market capitalization shock.

Figure 6. Impulse response to Rand exchange rate shock.
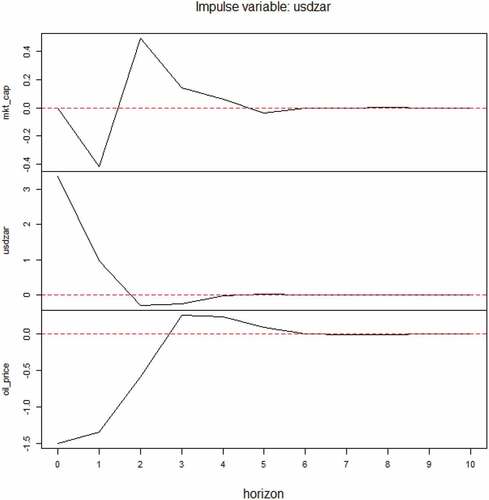
Figure 7. Impulse response to oil price shock.
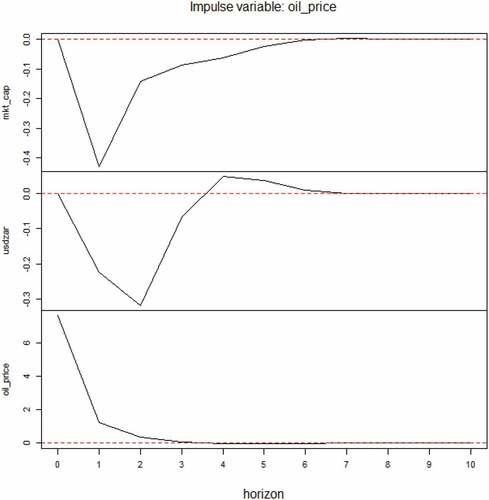
Figure 8. Smoothened probabilities for parameter impacts on stock market performance.
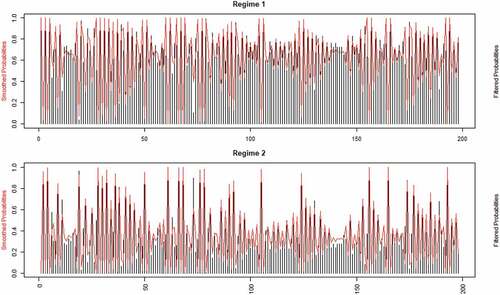
Figure 9. Smoothened probabilities for parameter impacts on oil price.
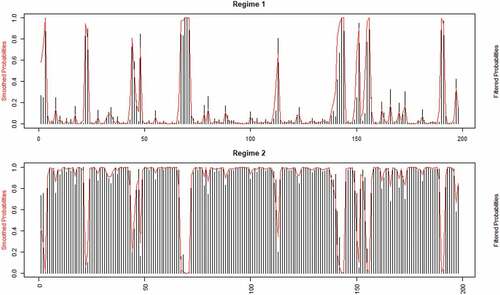
Figure 10. Smoothened probabilities for parameter impacts on exchange rate.
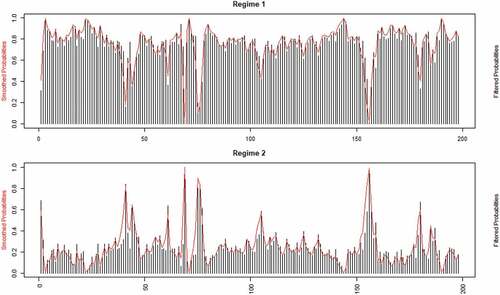
Table 3. Multivariate Markov regime switching results