
Figures & data
Table 1. Volatility modelled index summary
Table 2. Risk-free rate index summary
Table 3. Summary of strategy returns
Figure 1. Relative performance of the six indices from January 1995 to December 2020.
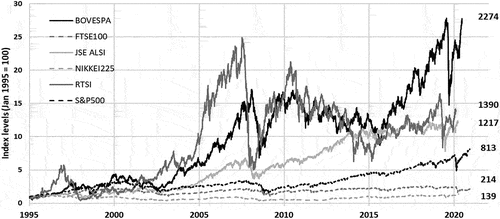
Figure 2. (a,b,c): Relative performance of the six developing economies indices from January 1995 to December 2020. (d,e,f): Relative performance of the six developed economies indices from January 1995 to December 2020.
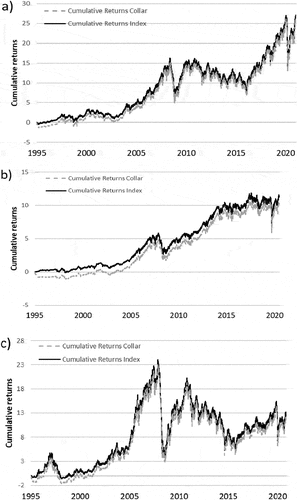
Figure 2. Continued.
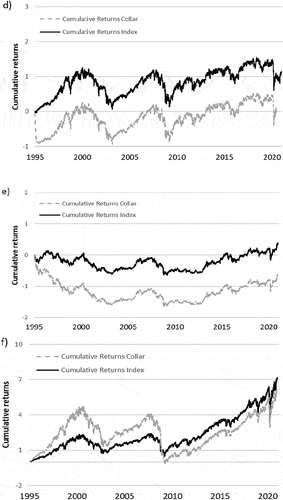
Figure 3. (a): Cumulative returns of the S&P 500 Index and increasing put option strike prices. (b): Cumulative returns of the NIKKEI 225 Index and increasing put option strike prices. (c): Cumulative returns of the FTSE 100 Index and increasing put option strike prices. (d): Cumulative returns of the JSE ALSI Index and increasing put option strike prices. (e): Cumulative returns of the BOVESPA Index and increasing put option strike prices. (f): Cumulative returns of the RTSI Index and increasing put option strike prices.
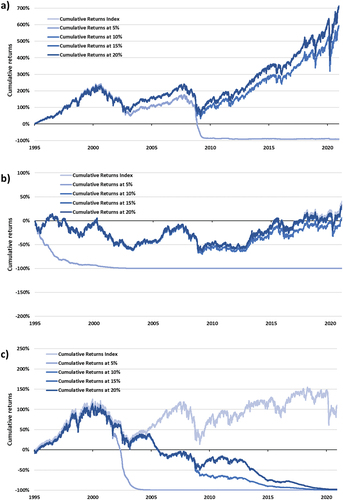
Figure 3. Continued.
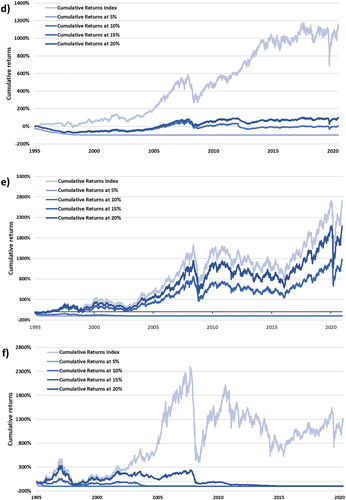
Figure 4. (a): Volatility levels for the ZCC implemented on the S&P 500 indices as underlying, as a function of put option strike levels and turbulent market conditions. (b): Volatility levels for the ZCC implemented on the NIKKEI 225 as underlying, as a function of put option strike levels and turbulent market conditions. (c): Volatility levels for the ZCC implemented on the FTSE 100 indices as underlying, as a function of put option strike levels and turbulent market conditions. (d): Volatility levels for the ZCC implemented on the JSE ALSI indices as underlying, as a function of put option strike levels and turbulent market conditions. (e): Volatility levels for the ZCC implemented on the BOVESPA as underlying, as a function of put option strike levels and turbulent market conditions. (f): Volatility levels for the ZCC implemented on the RTSI indices as underlying, as a function of put option strike levels and turbulent market conditions.
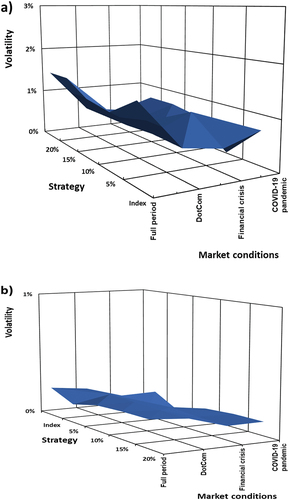
Figure 4. Continued.
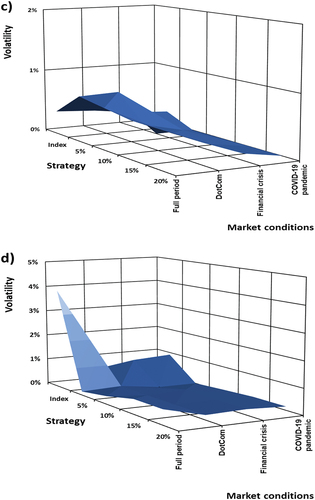
Figure 4. Continued.
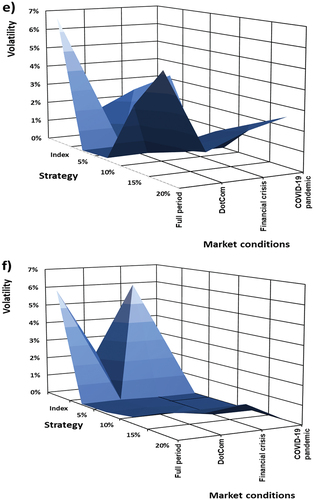
Figure 5. (a): Cumulative return as a function of put option strike levels and turbulent market conditions on the S&P 500. (b): Cumulative return as a function of put option strike levels and turbulent market conditions on the NIKKEI 225. (c): Cumulative return as a function of put option strike levels and turbulent market conditions on the FTSE 100. (d): Cumulative, as a function of put option strike levels and turbulent market conditions on the JSE ALSI. (e): Cumulative, as a function of put option strike levels and turbulent market conditions on the BOVESPA. (f): Cumulative, as a function of put option strike levels and turbulent market conditions on the RTSI.
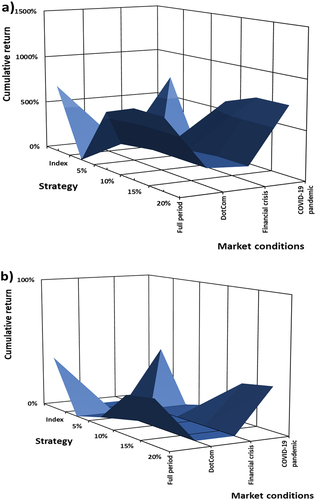
Figure 5. Continued.
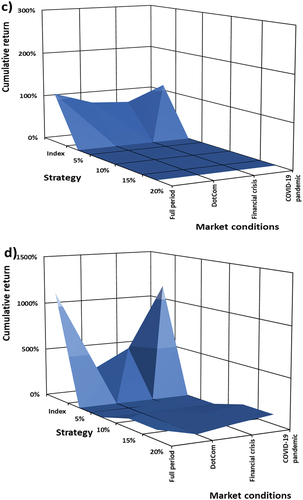
Figure 5. Continued.
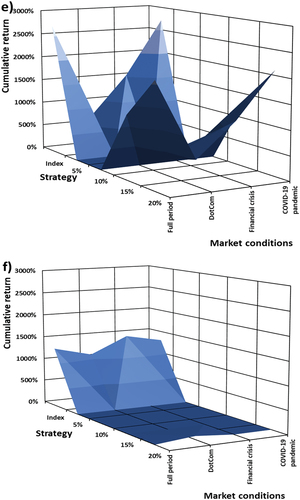
Table 4. Summary of ZCC strategy statistics and performance in the Dotcom bubble
Table 5. Summary of ZCC strategy statistics and performance in the financial crisis
Table 6. Summary of ZCC strategy statistics and performance in the COVID-19 pandemic