
Figures & data
Table 1. Descriptive statistics
Figure 1. Plot of daily trading activity panel A: daily number of transactions panel B: Daily trade volume.
The figures show graphs of the daily number of transaction and volume trades in Thousand from our sample. Daily number transactions (TRANS) and volume trades (VOLUME) are collected on a daily basis (regardless of being short-sale transaction or not). The suffix “_S.H.”, “_NOSH” denote that the variables are from the trading activity treatment and control group, respectively. “SHSELL” denotes that the variables account for the short-sale transactions only. Panel A presents the average daily number of transactions, while the panel B presents the average number of shares traded per day. The dotted blue line is the treatment group, and the dotted green line is the control group. The solid red line is transaction and volume from the short-sale only. The left vertical axis is for the dotted lines, and the right vertical axis is for the solid line. The solid vertical line depicts the 13 March 2020 when the uptick rule is imposed by the SET.
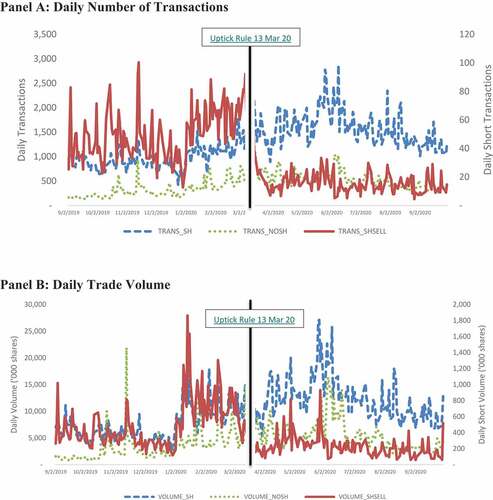
Table 2. Market quality measures and short selling uptick rules
Table 3. Daily volatility
Table 4. High-frequency volatility
Table 5. Return on the event days
Table A1. Sample stocks and size (in million Baht) in the treatment group and control group