
Figures & data
Figure 1. Growth of services, goods, and total (goods and services) exports in Kenya, 1975–2019.
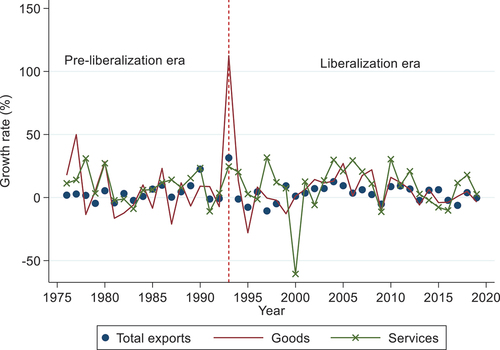
Figure 2. Kenya’s service exports (1995–2019).
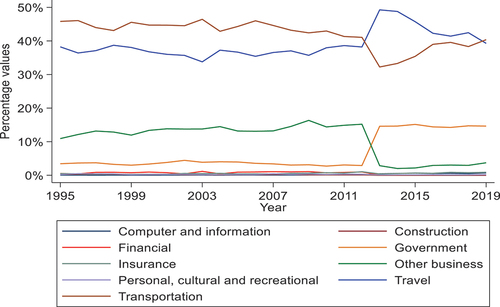
Table 1. Survival dynamics by total and categories of services in Kenya
Figure 3. Export survival by GATS.
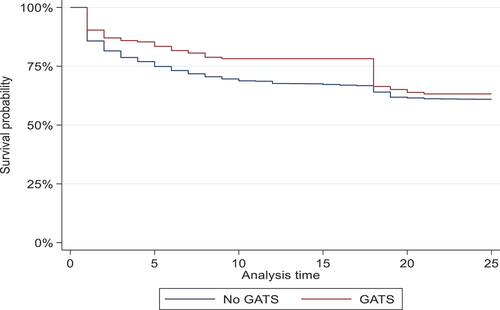
Figure 4. Export survival by geographical region.
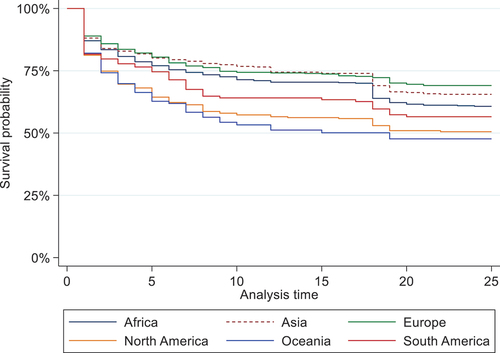
Table 2. Estimation results of the discrete-time hazard models with random effects
Table 3. Probit regression marginal effects results by service
Table 4. Probit regression marginal effects results by geographical regions
Table 5. Probit regression marginal effects results for trade facilitation indicators
Table A1. Variable definition, measurement and source
Table A2. Leading destinations of service exports from Kenya, 1995 to 2019
Table A3. Summary statistics