
Figures & data
Table 1. Summary statistics of key variables
Figure 1. Analytical framework of the study.
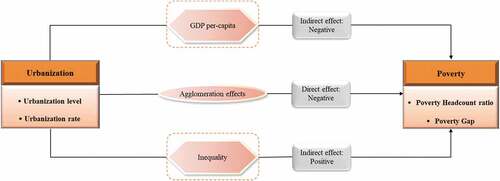
Table 2. Alternative estimates for the lagged dependent variable ( of EquationEquation (2)
(2)
(2)
Table 3. Correlation matrix of key variables
Figure 2. Scatterplot of the relationship between urbanization level and the poverty headcount: 1985–2019.
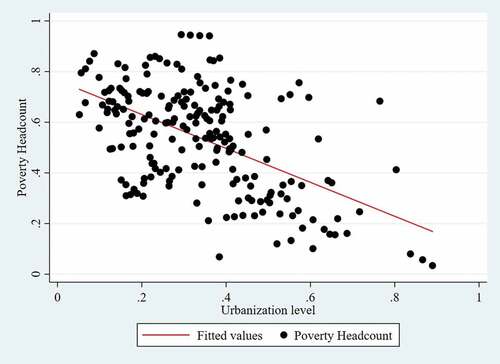
Figure 3. Scatterplot of the relationship between urbanization level and the poverty gap: 1985–2019.
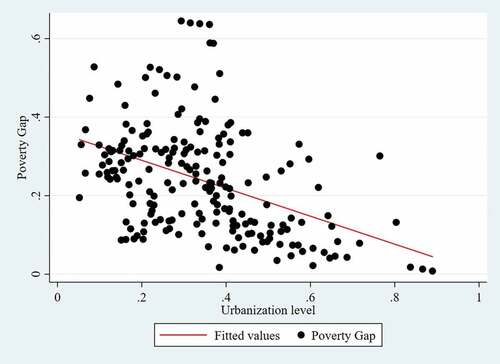
Table 4. Regression results for urbanization and poverty headcount ratio
Table 5. Regression results for urbanization and poverty gap
Table 6. Comparing the growth rates and levels of urbanization elasticities of poverty