
Figures & data
Table 1. Descriptive statistics of variables (2007 to 2018)
Table 2. Stochastic frontier estimates
Table 3. Drivers of inefficiencies in financial stability
Figure 1. Financial stability (FS) gap in SSA countries.
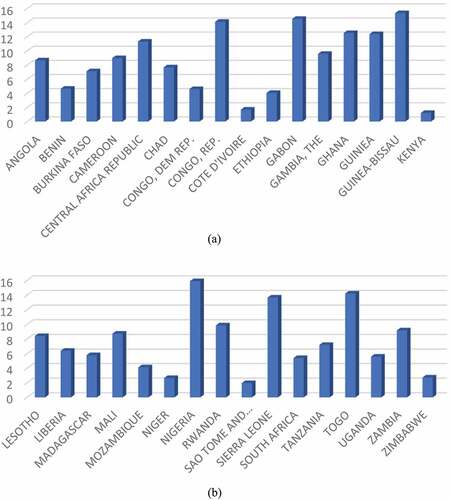
Figure 2. Mean potential, actual, efficiency and gap in financial stability for sub-regional communities in SSA.
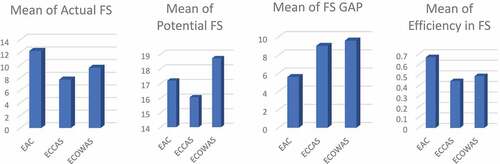
Table 4. Mean of efficiency, potential, actual, and gap in financial stability (FS) in SSA countries (2007 to 2018)
Table 5. Mean of efficiency, potential, actual, and gap in financial stability (FS) in sub-regional groups in SSA (2007 to 2018)
Table A6. List of SSA countries considered for the study
Table B7. List of countries in the sub-regional communities understudy
Table C8. Variable description and sources
Table D9. Variance inflation factor test for multicollinearity