
Figures & data
Figure 1. Change in the monthly VIX Index and Monthly US stock index returns (January 2000-December 2019).
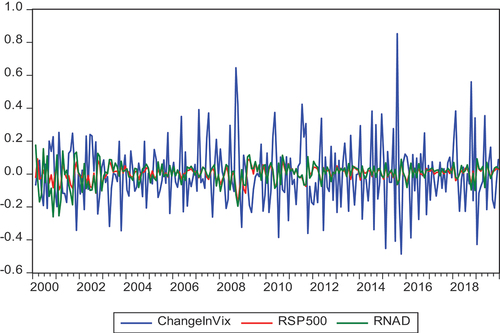
Table 1. Definition of variables
Table 2. Summary statistics
Figure 2. Estimated coefficients and 95% confidence interval.
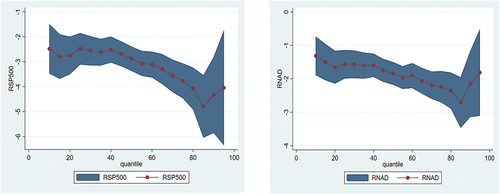
Table 3. Change in the monthly VIX Index and Monthly stock market returns (January 2000 – December 2019)
Table 4. Change in the VIX Index and Market leverages (2000–2019)
Table 5. Two-clustering approach for panel model (2000–2019)
Table 6. IV regression for panel data with a fixed effect (2000–2019)
Table 7. Testing on a sample of Nasdaq Composite’s listed firms (2000–2019)