
Figures & data
Table 1. Data description: country-wise market indices and data periods
Table 2. Information spillovers and financial integration index for the sample markets
Table 3. Unadjusted returns for size-sorted deciles
Table 4. Unadjusted returns for value-sorted deciles
Table 5. Unadjusted Returns for Prior returns-sorted Deciles
Table 6. Unadjusted returns for liquidity-sorted deciles
Table 7. Unadjusted returns for profitability-sorted deciles
Table 8. Unadjusted returns for investment-sorted deciles
Figure 1. Mean returns on decile portfolios.(a) unadjusted returns for size-sorted decile portfolios.(b) unadjusted returns for value-sorted decile portfolios.(c) unadjusted returns for momentum-sorted decile portfolios.(d) unadjusted returns for liquidity-sorted decile portfolios.(e) unadjusted returns for profitability-sorted decile portfolios.(f) unadjusted returns for investment-sorted decile portfolios.
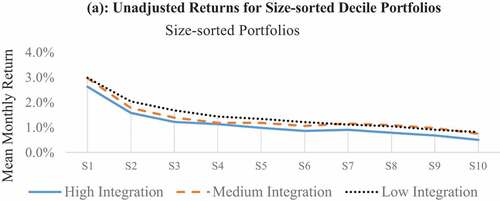
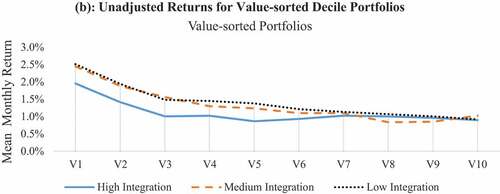
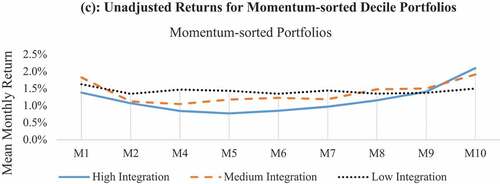
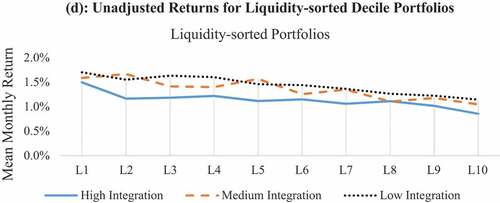
Figure 1. Continued.
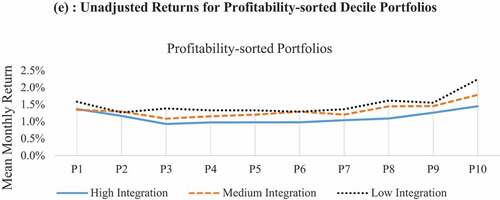
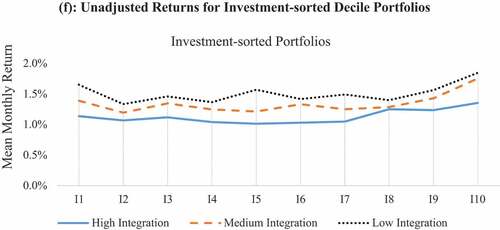
Figure 2. Return differentials on decile portfolios in three financial integration groups.
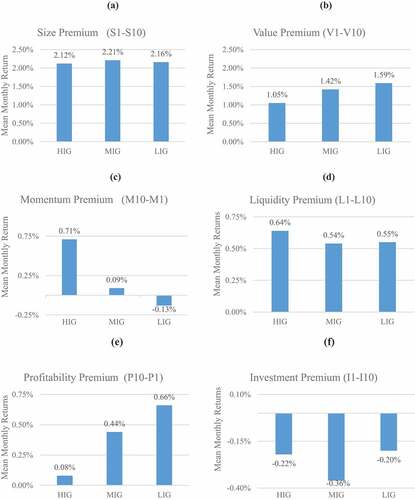
Figure 3. Return differentials on market anomalies for sample countries.
Table 9. Mean monthly return differentials on characteristic-sorted corner portfolios
Table 10. Testing for significance in risk and return
Table 11. Correlation between characteristic and return premiums
Table 12. Goodness-of-fit of alternative asset pricing benchmarks using local factors
Table 13. Goodness-of-fit of alternative asset pricing benchmarks using world factors
Table 14. Goodness-of-fit of alternative asset pricing benchmarks using hybrid factors
