
Figures & data
Figure 1. Conceptual framework of the study.
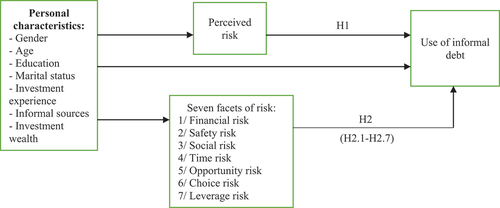
Table 1. A summary of the variables
Table 2. Data statistics of the study
Figure 2. Financial risk among investors.
This figure shows concern about financial loss and the importance of losing money. The majority of investors are concerned about the loss-to-equity ratio from 10% to 20%, followed by the loss ratio from 20% to 50%. Interestingly, fewer investors are concerned about the loss of less than 10% of equity.
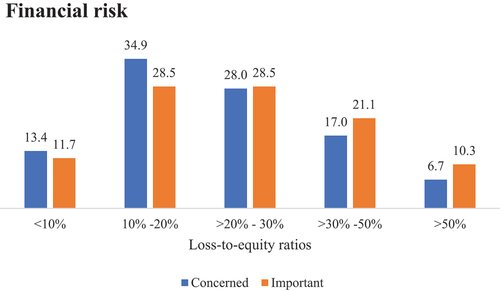
Table 3. Results of correlation test
Table 4. Results of the reliability of perceived risk and its facets
Figure 3. Borrowing sources, perceived risk and informal debt using the SEM approach.
SEM model fit criteria: Chi-square: 0.18, Df: 1, GFI: 1.000, TLI: 1.057, CFI: 1.000, RMSEA:0.044
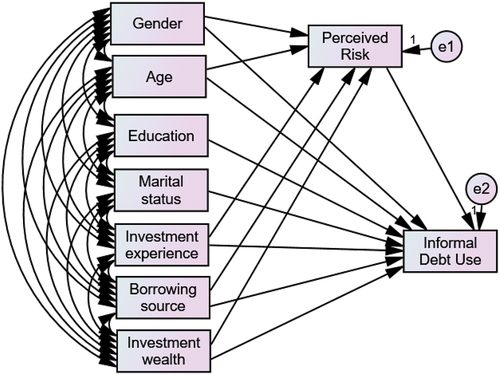
Table 5. Perceived risk and informal debt use
Table 6. Facets of risk and informal debt use
Table 7. Demographic predictors of perceived risk
Table 8. Determinants of facets of risk
Table 9. Borrowing sources and informal debt use
Supplemental material