
Figures & data
Table 1. Descriptive statistics
Figure 1. Time series plot of commodity prices of cocoa, gold, oil and silver and St. Louis Fed Financial Stress (STLF13) and Chicago Fed National Condition Index (NFCI).
Figure 2. Wavelet coherence of NFCI and global commodities prices.
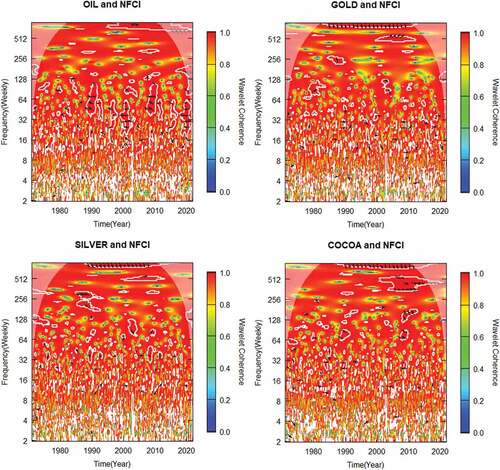
Figure 3. Wavelet coherence of STLF13 and global commodities prices. Panel A) Full sample, Panel B) Pre-GFC, Panel C) GFC, Panel D) Post-GFC.
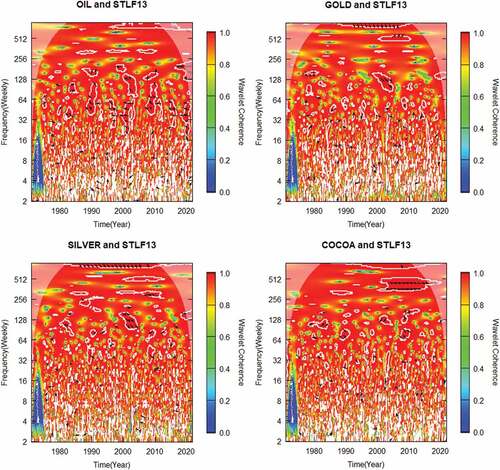
Figure 4. Wavelet bivariate correlation matrix. Panel A: Full sample, Panel B: Pre-GFC, Panel C: GFC, Panel D: Post-GFC.
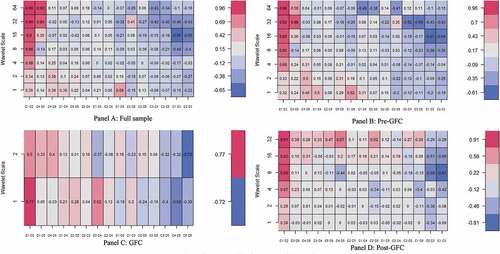
Figure 5. Multiple wavelet correlations between FSI and global commodities prices. Panel A: Full sample, Panel B: Pre-GFCPanel C: GFC, Panel D: Post-GFC.
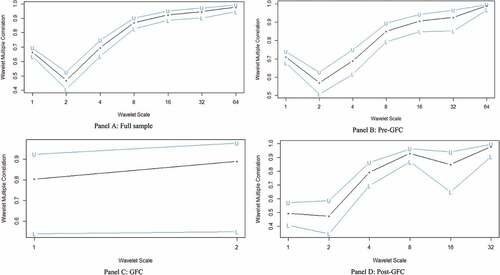
Figure 6. Multiple cross-correlations of wavelets.
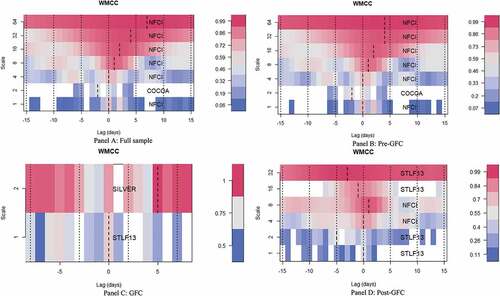
Table A1. Wavelet multiple correlations
Table A2. Wavelet multiple cross-correlations