Figures & data
Table 1. Summary of the empirical literature
Figure 1. Relationship between domestic and international prices.
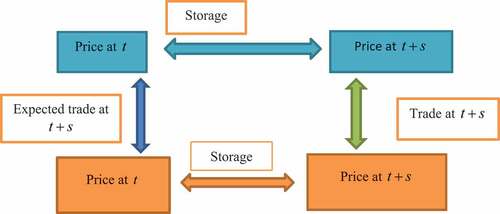
Table 2. Variables description and descriptive statistics
Table 3. Kapetanios & Shin unit root test
Table 4. ARDL bounds Cointegration, and Bayer and Hanck Cointegration Tests
Table 5. Long-run coefficients
Table 6. Error correction representation for the selected ARDL model
Table 7. NARDL Co-integration Test
Figure 2. Plot of the cumulative sum of recursive residuals.
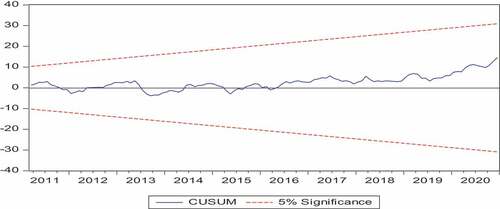
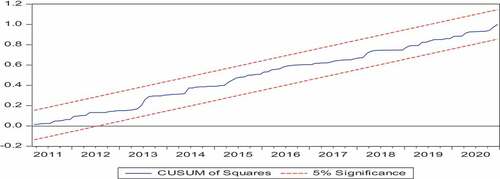
Figure 3. Plot of the cumulative sum of squares of recursive residuals.
Table
Table 8. VAR lag order selection criteria
Table 9. Toda-Yamamoto Granger causality test result
Table 10. Frequency Domain Causality Test
Figure 4. Effect of counterfactual shock in world coffee prices on ECX coffee prices.
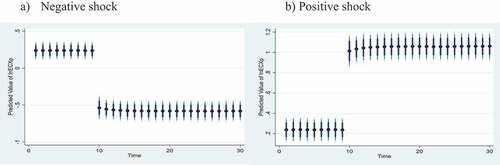
Figure 5. Effect of counterfactual shock in the exchange rate on ECX coffee prices.
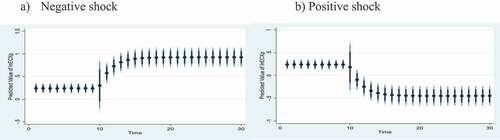
Figure 6. Effect of counterfactual shock in a volume of export on ECX coffee prices.
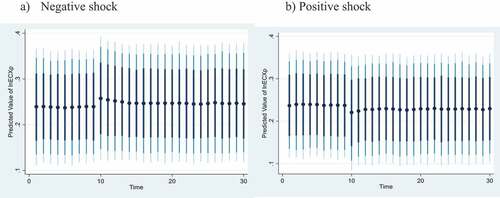
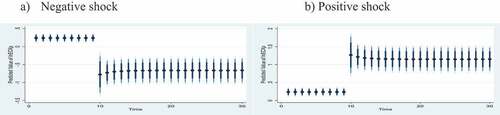
Figure 7. Effect of counterfactual shock in the interest rate on ECX coffee prices. (a) Negative shock. (b) Positive shock.
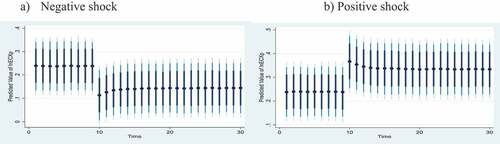
Figure 8. Effect of counterfactual shock in money supply on ECX coffee prices.
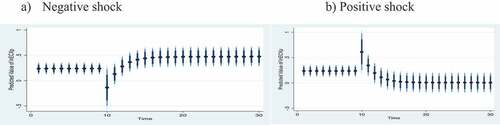
Figure 9. Effect of counterfactual shock in trade openness on ECX coffee prices.
Figure 10. Effect of counterfactual shock in GPD on ECX coffee prices.