
Figures & data
Figure 1. Mechanism through which monetary policy could affect climate change (CO2 emissions).
Table 1. Summary of related empirical evidence on the ecological effect of monetary policy
Figure 2. The overall picture of per capita CO2 emissions for 14 selected emerging countries covering the period of 1998–2018.
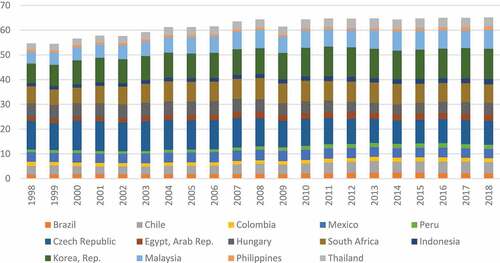
Table 2. Data description
Table 3. Descriptive statistics
Table 4. LLC-based and IPS-based unit root test of stationary
Table 5. Panel co-integration tests by Pedroni (Citation1999)
Table 6. Panel co-integration tests by Kao (Citation1999)
Table 7. Long-run coefficient by OLS, DOLS, and FMOLS (Y = CO2)
Table 8. Quantile panel regression (Y = CO2)
Figure 3. Quantile regression estimates with 90% confidence intervals for the impacts of climate change determinants.
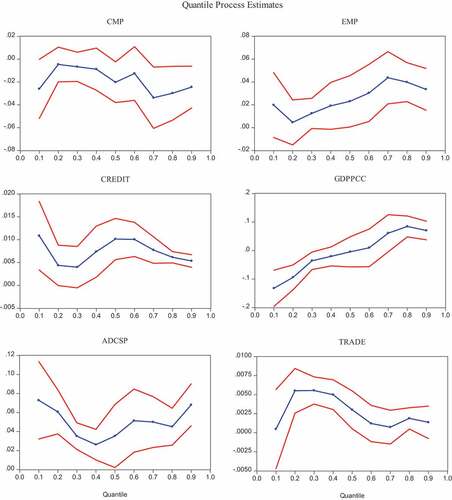
Table 9. Two-step system GMM estimation (Y =CO2)
Figure 4. Estimation outcomes of OLS, DOLS, FMOLS, GMM and panel quantile regression.
Table A1. Abbreviations and its definitions