
Figures & data
Table 1. Number of lender companies and average loan balance per company
Table 2. Descriptive statistics for each variable
Figure 1. Histogram of performance forecast bias.
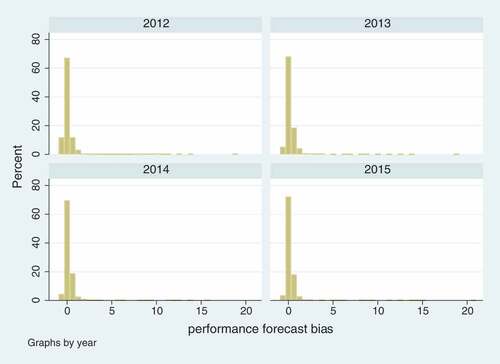
Figure 2. Histogram of lag in forecast ratio of performance.
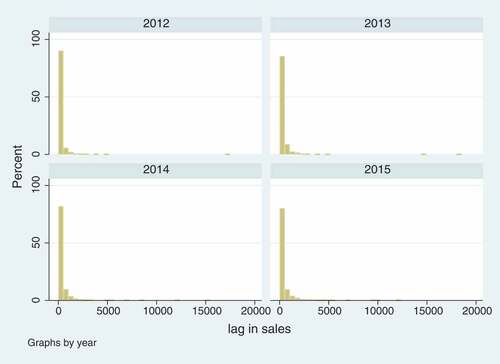
Figure 3. Histogram lag in profitability.
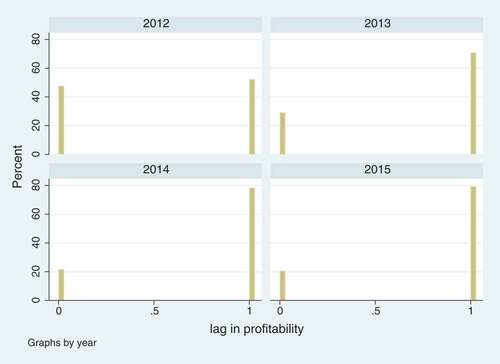
Figure 4. Histogram of lag in cash flow.
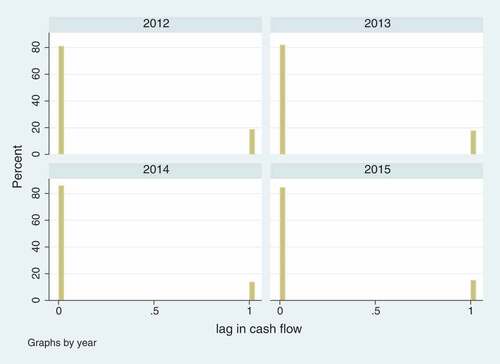
Figure 5. Histogram of lag in sales.
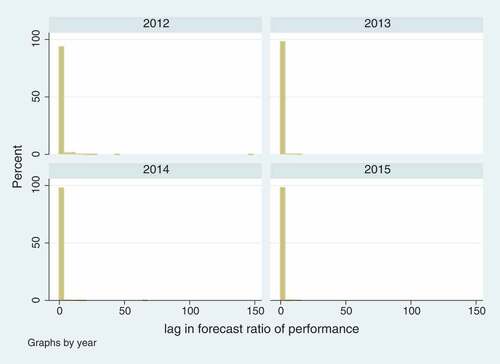
Table 3. Results of fixed effects model in panel regression model