
Figures & data
Figure 1. Production, consumption, stock and import of rice in Indonesia.
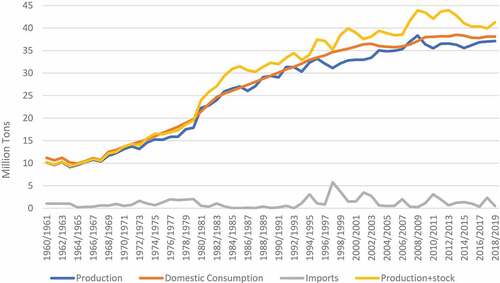
Figure 2. Wholesale rice price in Indonesia, January 2010-December 2020.
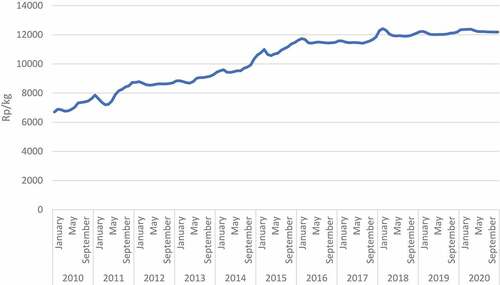
Figure 3. Percentage of household selling and keeping their rice production in Indonesia.
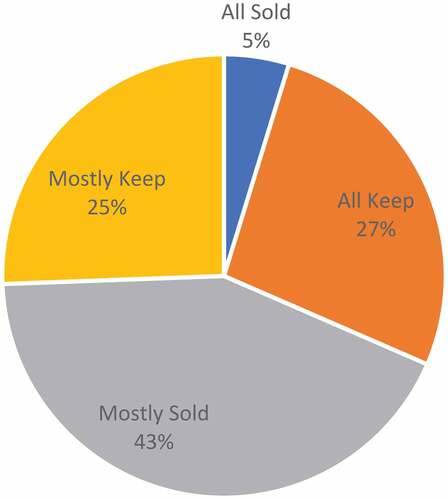
Figure 4. Percentage of rice quantity sold and kept by farmers in Indonesia.
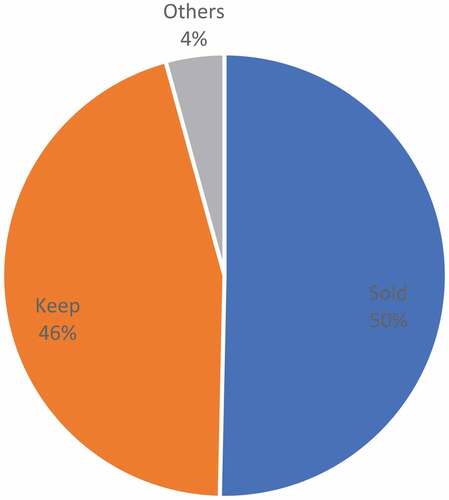
Figure 5. Percentage of household selling and keeping their rice production in three locations in Indonesia.
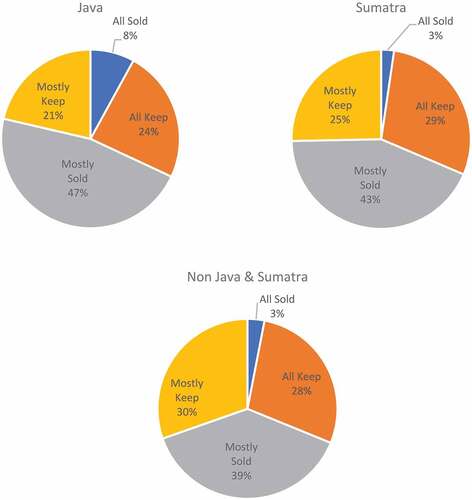
Figure 6. Percentage of rice quantity sold and kept by farmers in three locations in Indonesia.
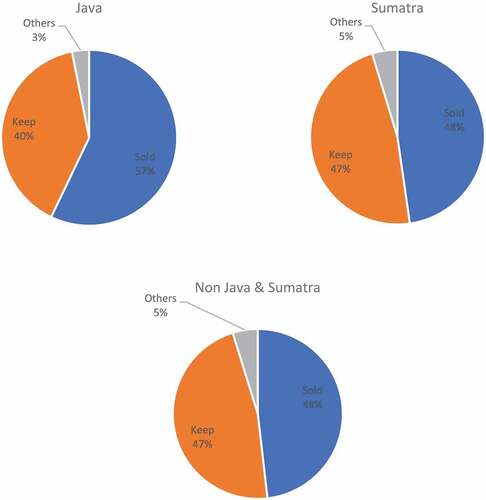
Table 1. Equation results for market participation and marketed surplus in Indonesia
Table 2. Equation results for market participation and marketed surplus in Java
Table 3. Equation results for market participation and marketed surplus in Sumatra
Table 4. Equation results for market participation and marketed surplus in outside Java and Sumatra